The news from the CTA last week was that a longtime trend of convergence between bus and rail ridership is, if anything, picking up speed:
It’s hard to overstate how big a transformation of Chicago’s transportation landscape this is. As recently as the 1990s, there were well over two bus riders for every rail rider; the city’s transit was as much about a crosstown streetcar-era bus grid as it was about a downtown-focused heavy rail network.
But rail ridership has nearly doubled in the last 20 years, and bus ridership – which stabilized in the early 1990s after a long period of precipitous decline – has begun to fall again in the last few years.
The reasons for that aren’t entirely clear. Ridership began a notable dip right after the 2008 economic crash, which makes sense – fewer employed people means fewer commutes. But the more recent decline, which seems to have started in 2012, is harder to explain. Precisely because it’s hard to explain, I suspect, many of the theories offered are quite vague: many of them are of the “people just don’t like buses” variety.
But I think any discussion of bus ridership in Chicago needs to include this chart, and take two things away from it.
1. First of all, declining bus ridership is not actually a “long-term” trend, though it’s often framed that way. (Or, to be more specific: decline is typical of the last 50 years, but not the last 10 or 20.) In fact, as recently as the mid-2000s, ridership was growing. And other than the deep recession years of 2009-2010, 2013-2014 represents the first multiyear ridership decline since the mid-1990s. This isn’t meant to wave the problem away: it actually makes it worse, since it suggests that far from experiencing a long, slow decline driven by structural factors, something specific has changed recently that’s made buses less attractive.
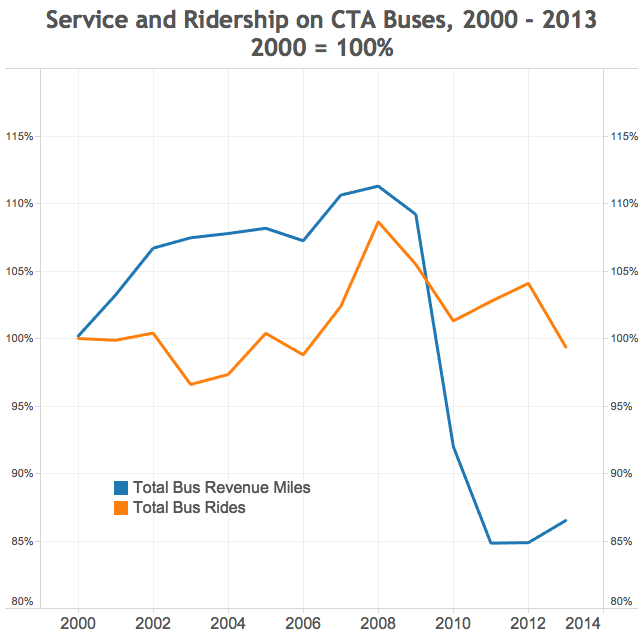
2. Secondly, service matters. I think it is probably not a coincidence that ridership growth in the 2000s came at a time when the CTA was adding service: reducing wait times between buses, expanding their hours, and introducing express routes. (Between 2002 and 2006, the CTA created ten “X” routes, which mostly followed existing bus lines, but stopped every half mile instead of every eighth. Almost all of them were discontinued in 2010 because of a budget shortfall.)
I think it is also probably not a coincidence that the CTA has had a difficult time recouping its bus ridership losses from the recession, given that its dramatic recession-era service cuts have mostly remained in place.
To be clear, this isn’t at all a slam on the CTA, which can’t raise significant revenue without raising fares. Moreover, it has launched some bus service improvements in the last few years – the Jeffery Jump, the “Loop Link” busway, and the proposed Ashland BRT – that make a good template for expansions into the rest of the system.

But the money for more broad-based, bread-and-butter improvements to service just hasn’t been there. And unlike rail customers – who are generally downtown commuters, and have to think about paying downtown parking rates if they want to ditch public transit – bus riders who already have a car face no such massive disincentive to using it. To be competitive, buses need to run frequently and reliably, and make decent time along their routes. They are absolutely capable of doing that, given relatively modest investments in operations funds, technology, and space. But we’re not making nearly enough of those investments.
