Chicago’s Growing Income Donut

Oh, the backlog of things I want to write! To work:

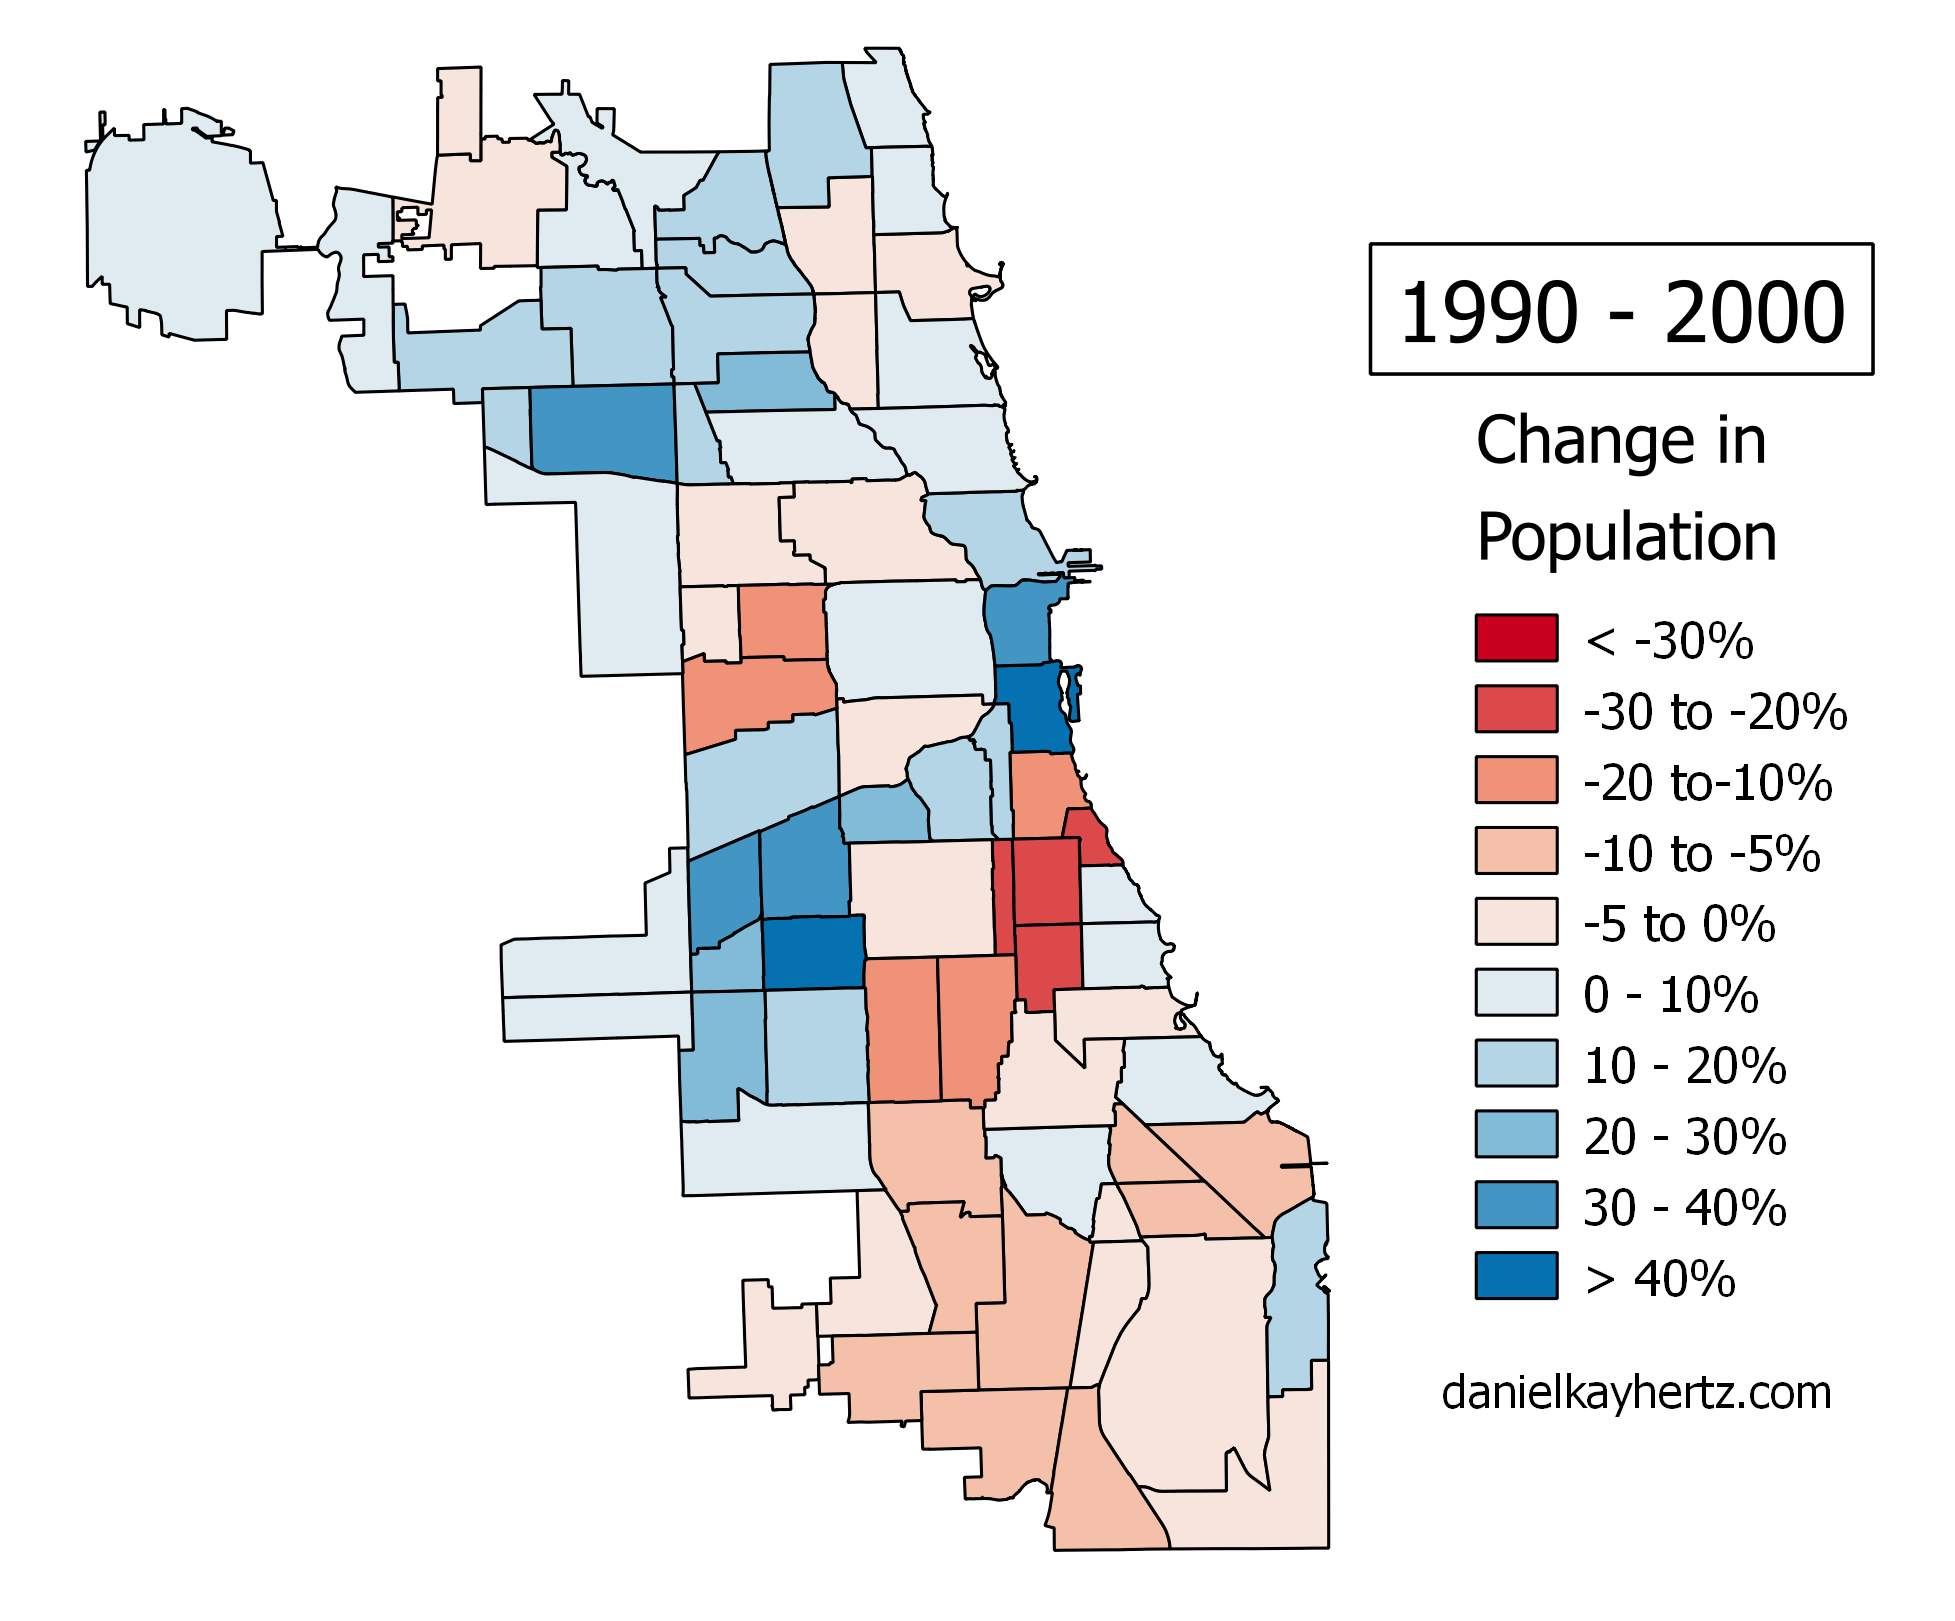
Other than “oy,” one of the most common reactions I got to the “vanishing middle class” maps I made several months ago was that focusing on the city proper necessarily missed the very important shifts occurring in the suburbs, where something like two-thirds of the people in the Chicago region live. In fact, it missed what was maybe one of the more important stories about the changing economic geography of the region over the last 40 years, which is a shift in the balance of economic power between the city and suburbs.

That’s true, so I’ve finally made equivalent maps for the entire Chicago metro area. (The researchers who provided my original data, Sean Riordan and Kendra Bischoff, made their own maps a little bit ago, and Whet Moser made some valuable graphs from their data. I’m going to use my own maps, though, from Brown’s Longitudinal Tract Database, so I can show the data in a way that’s most consistent with how I did the previous post.)

Here they are:

1970

1980

1990

2000

2010

IncGIF

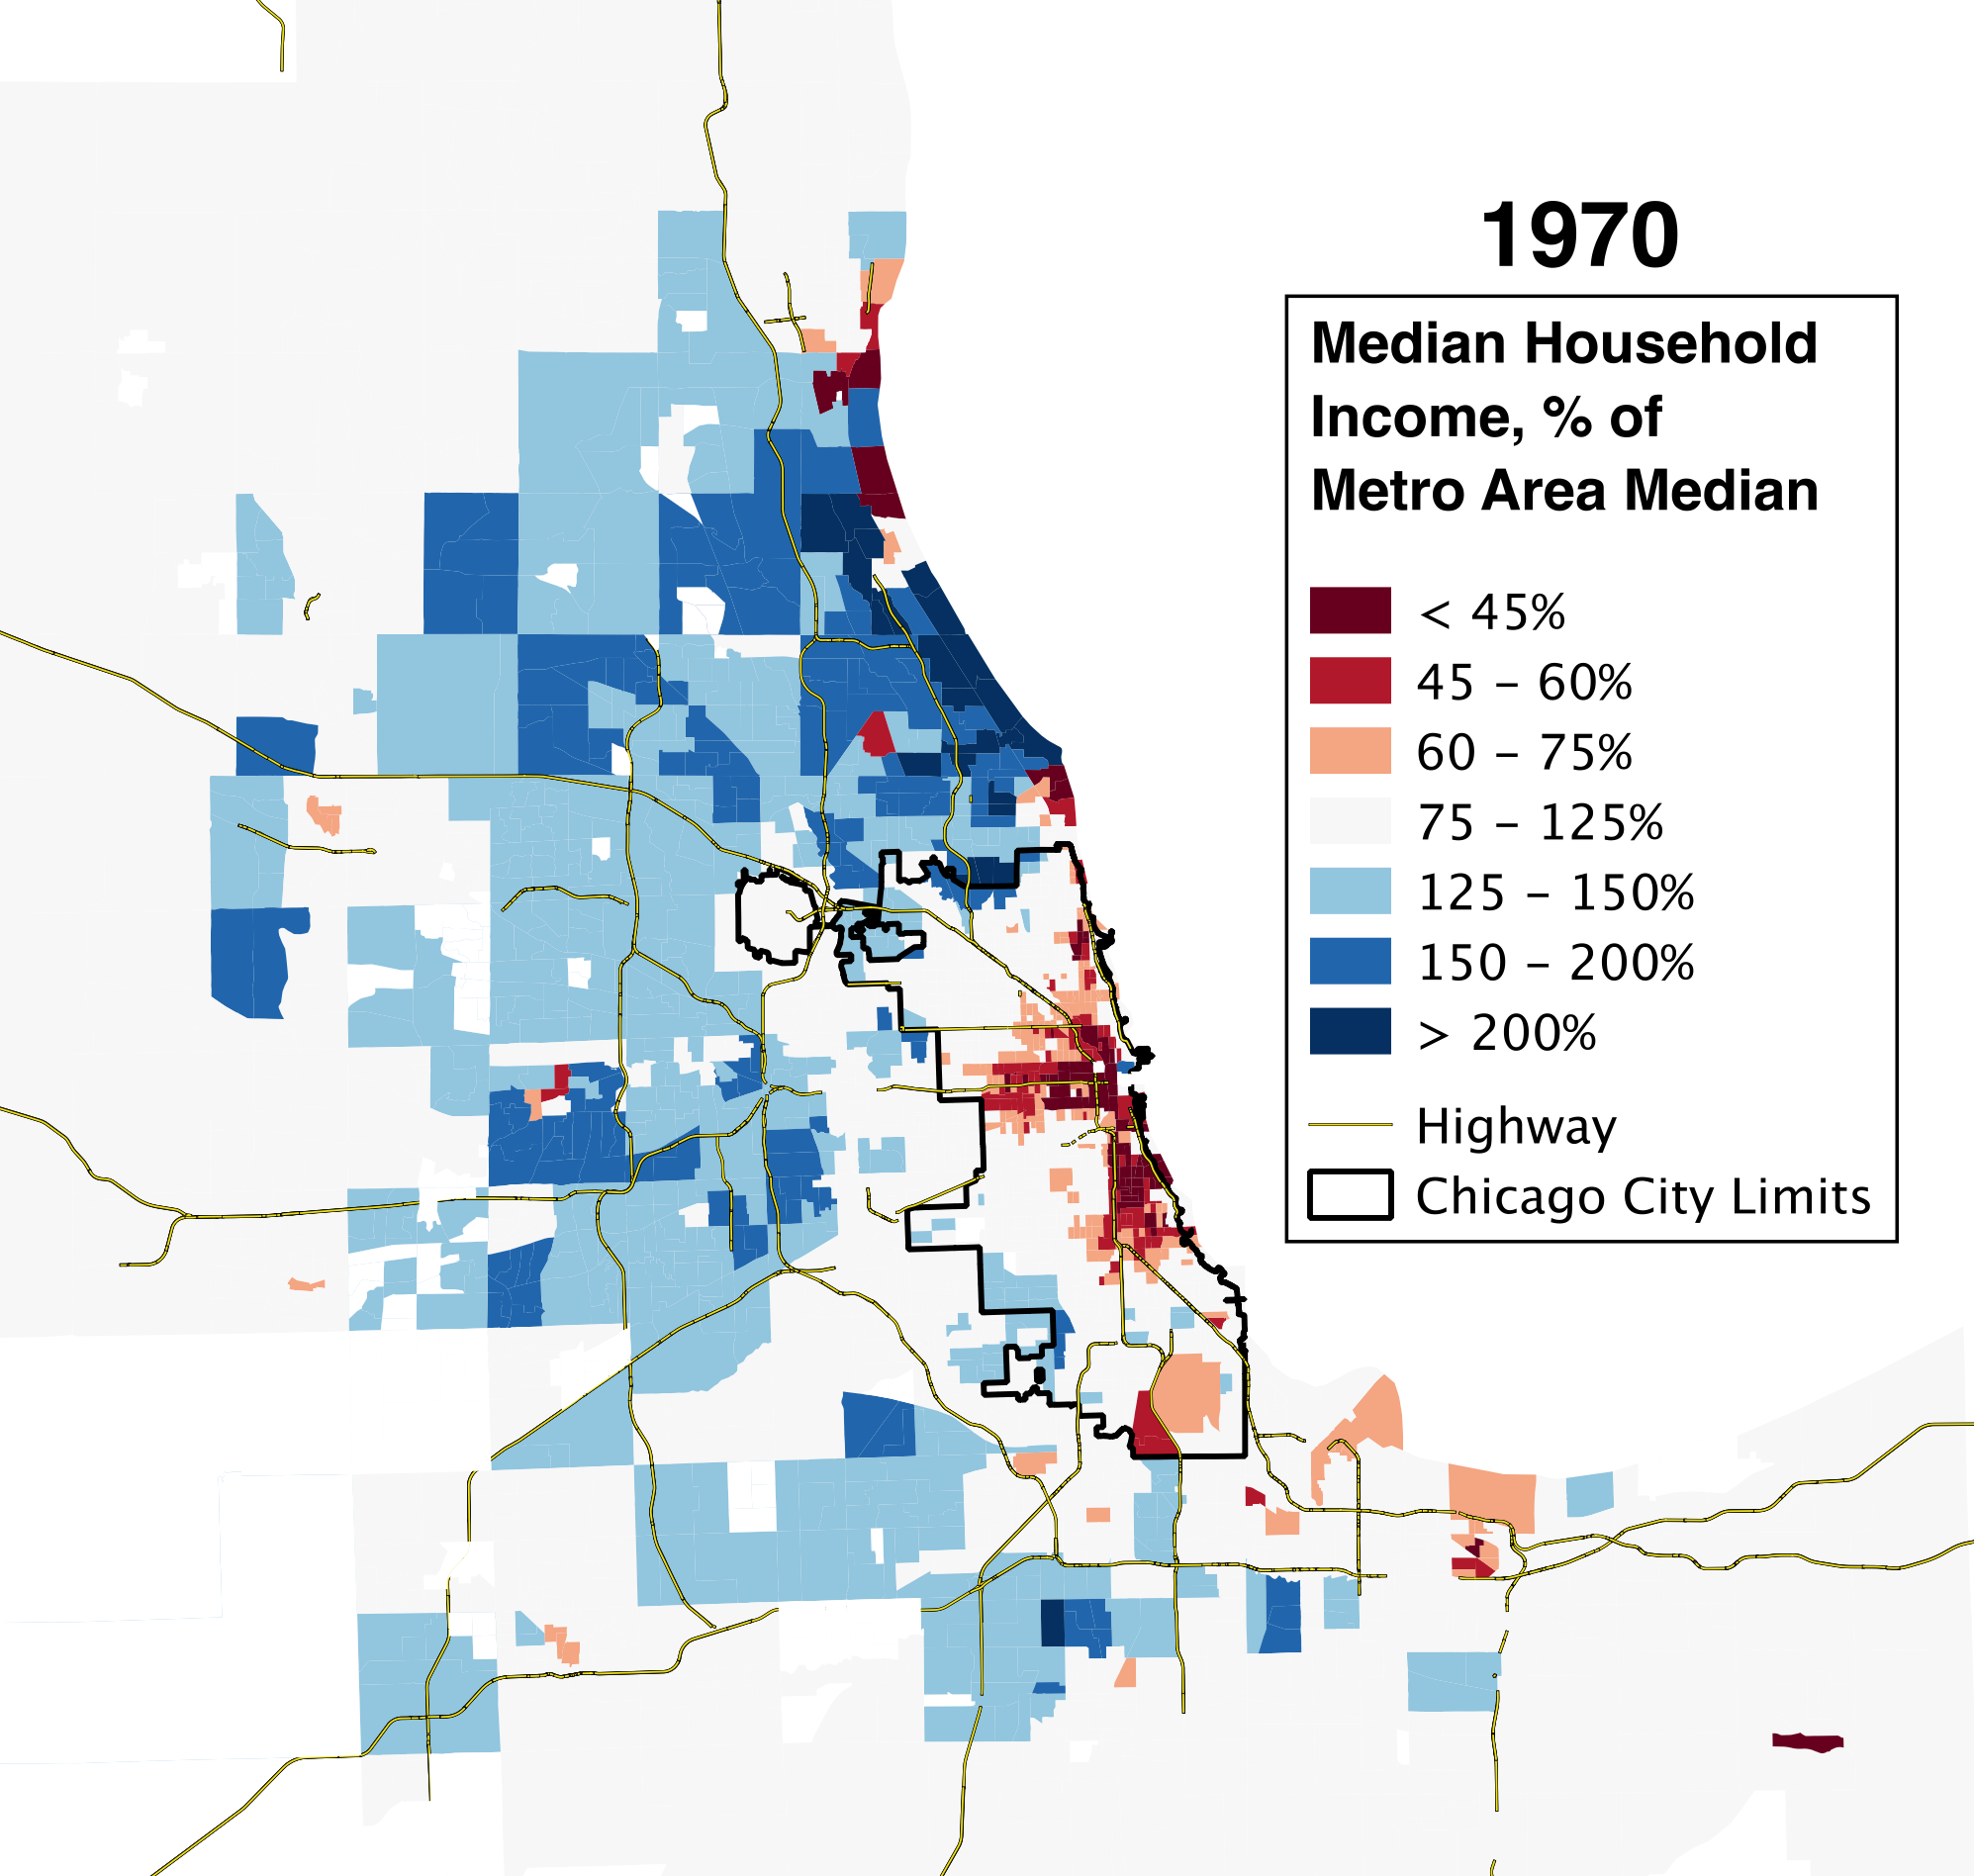
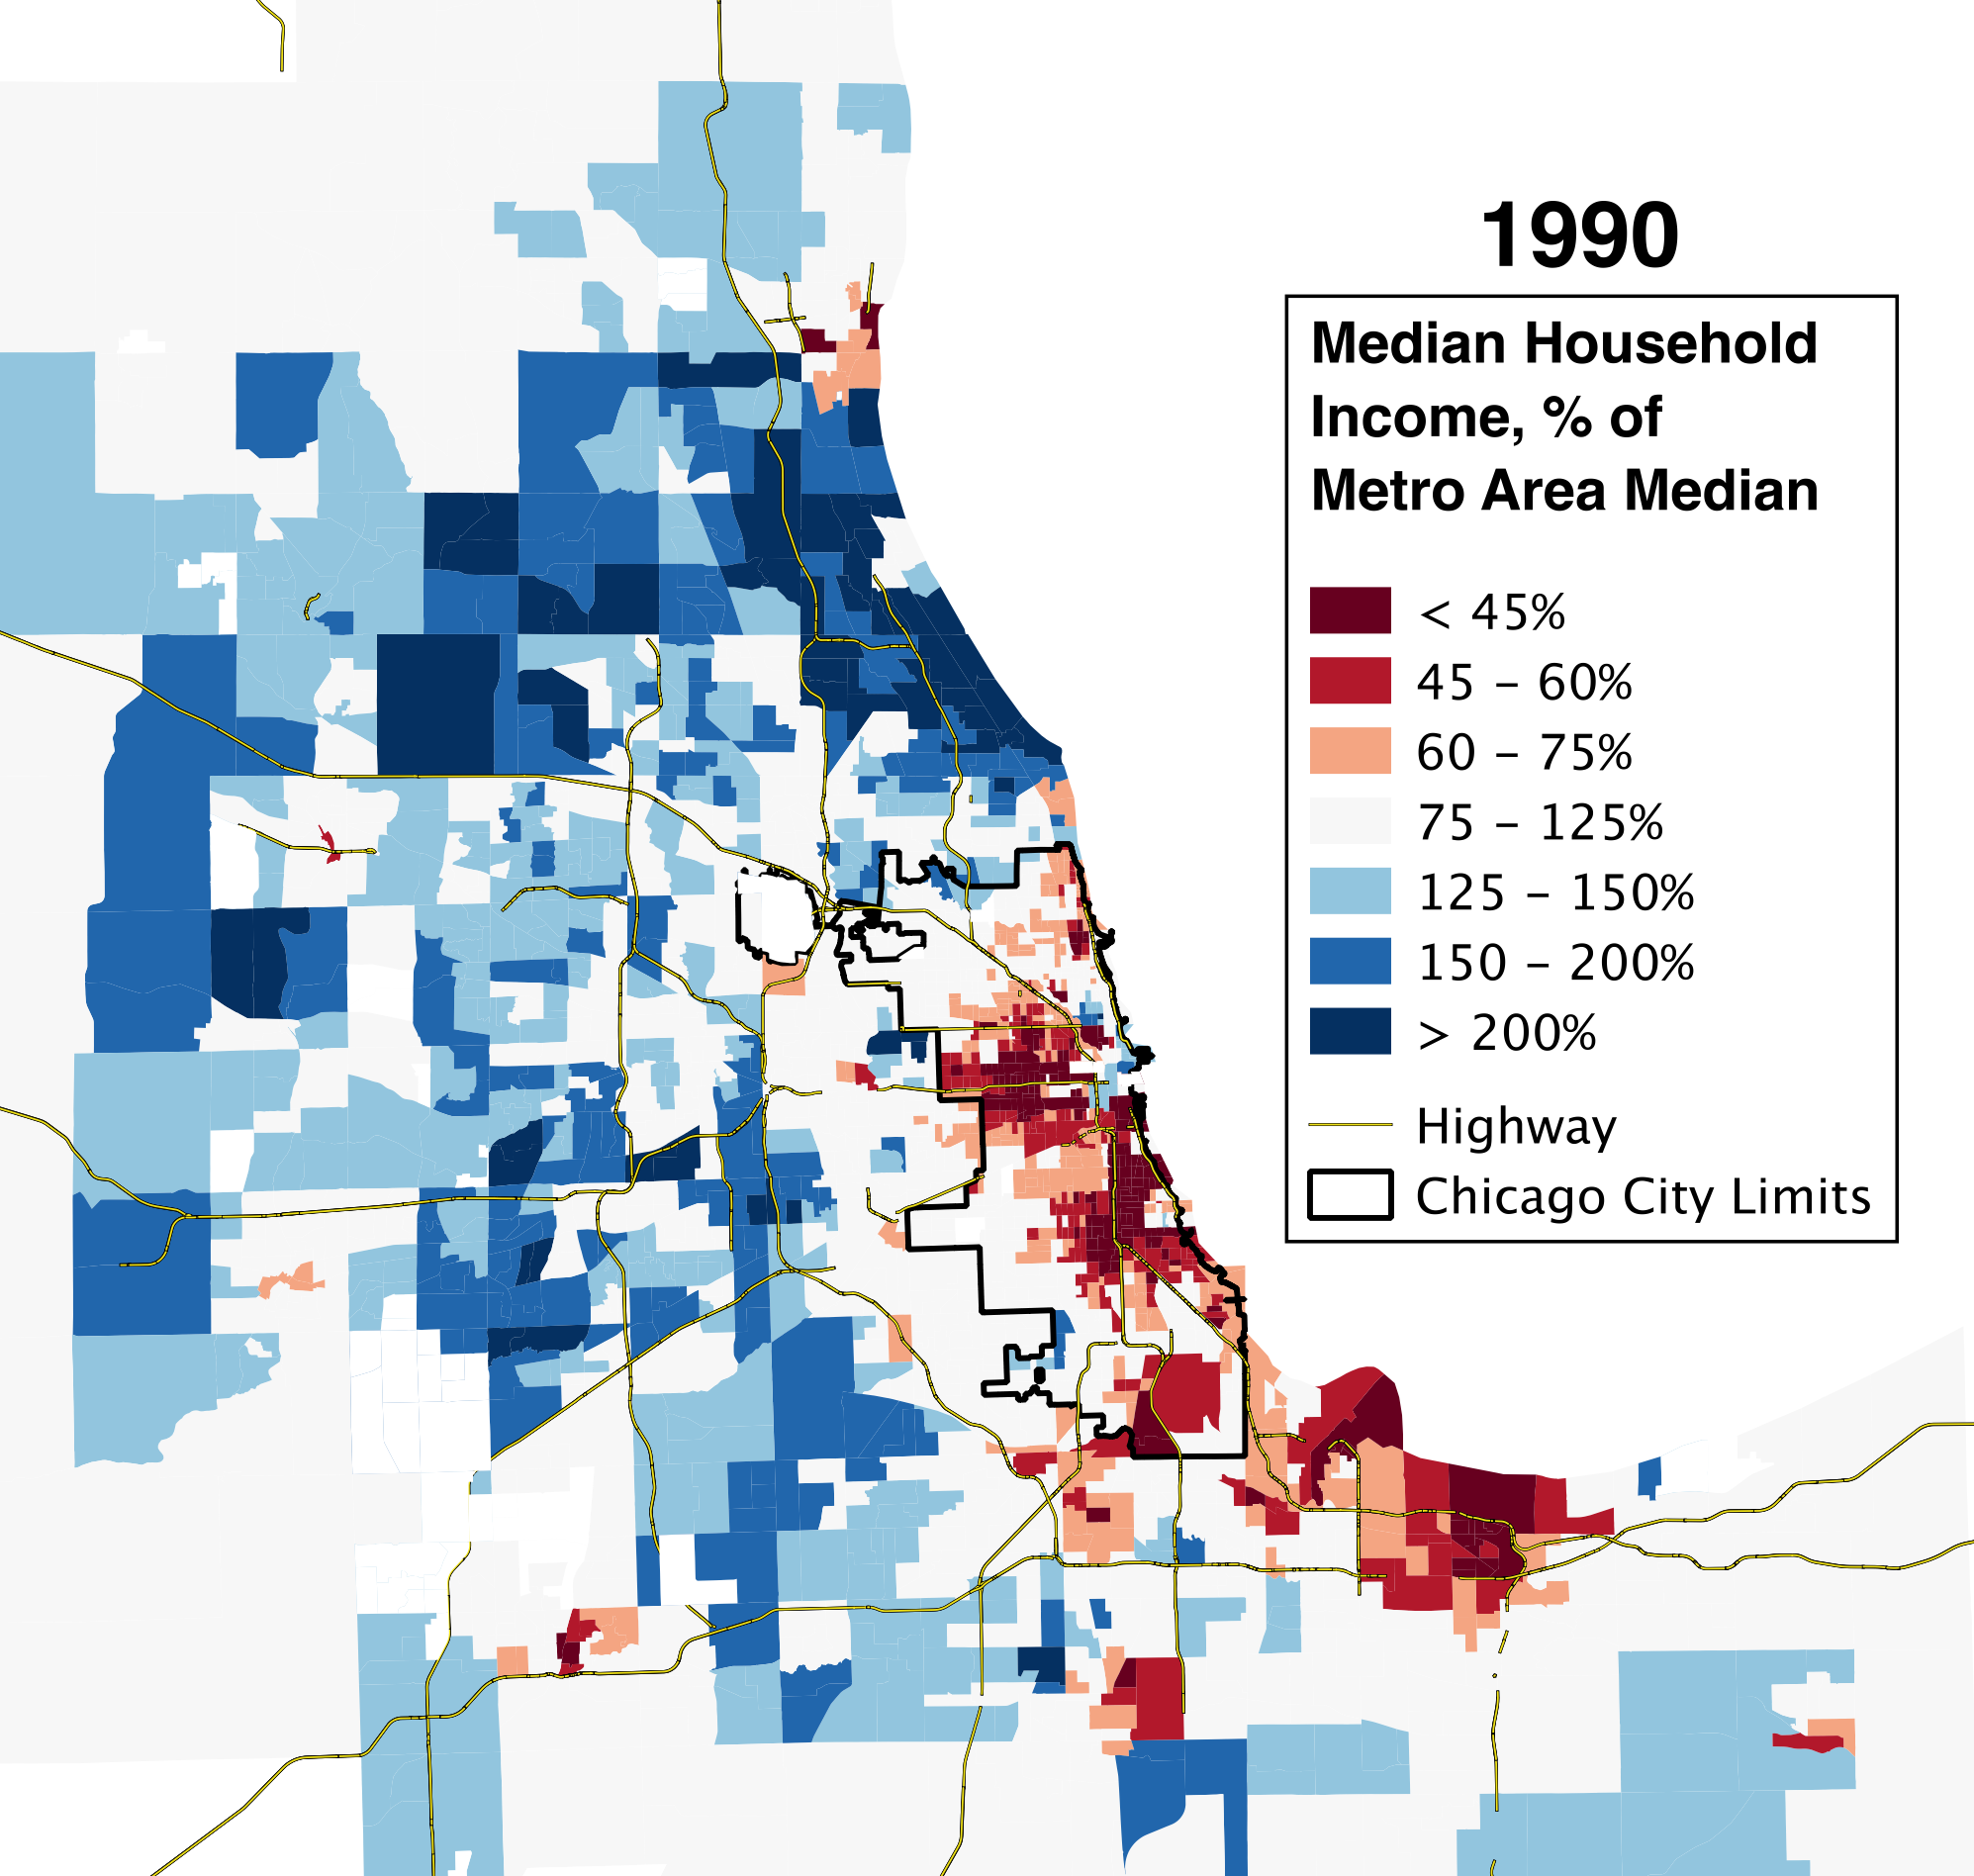
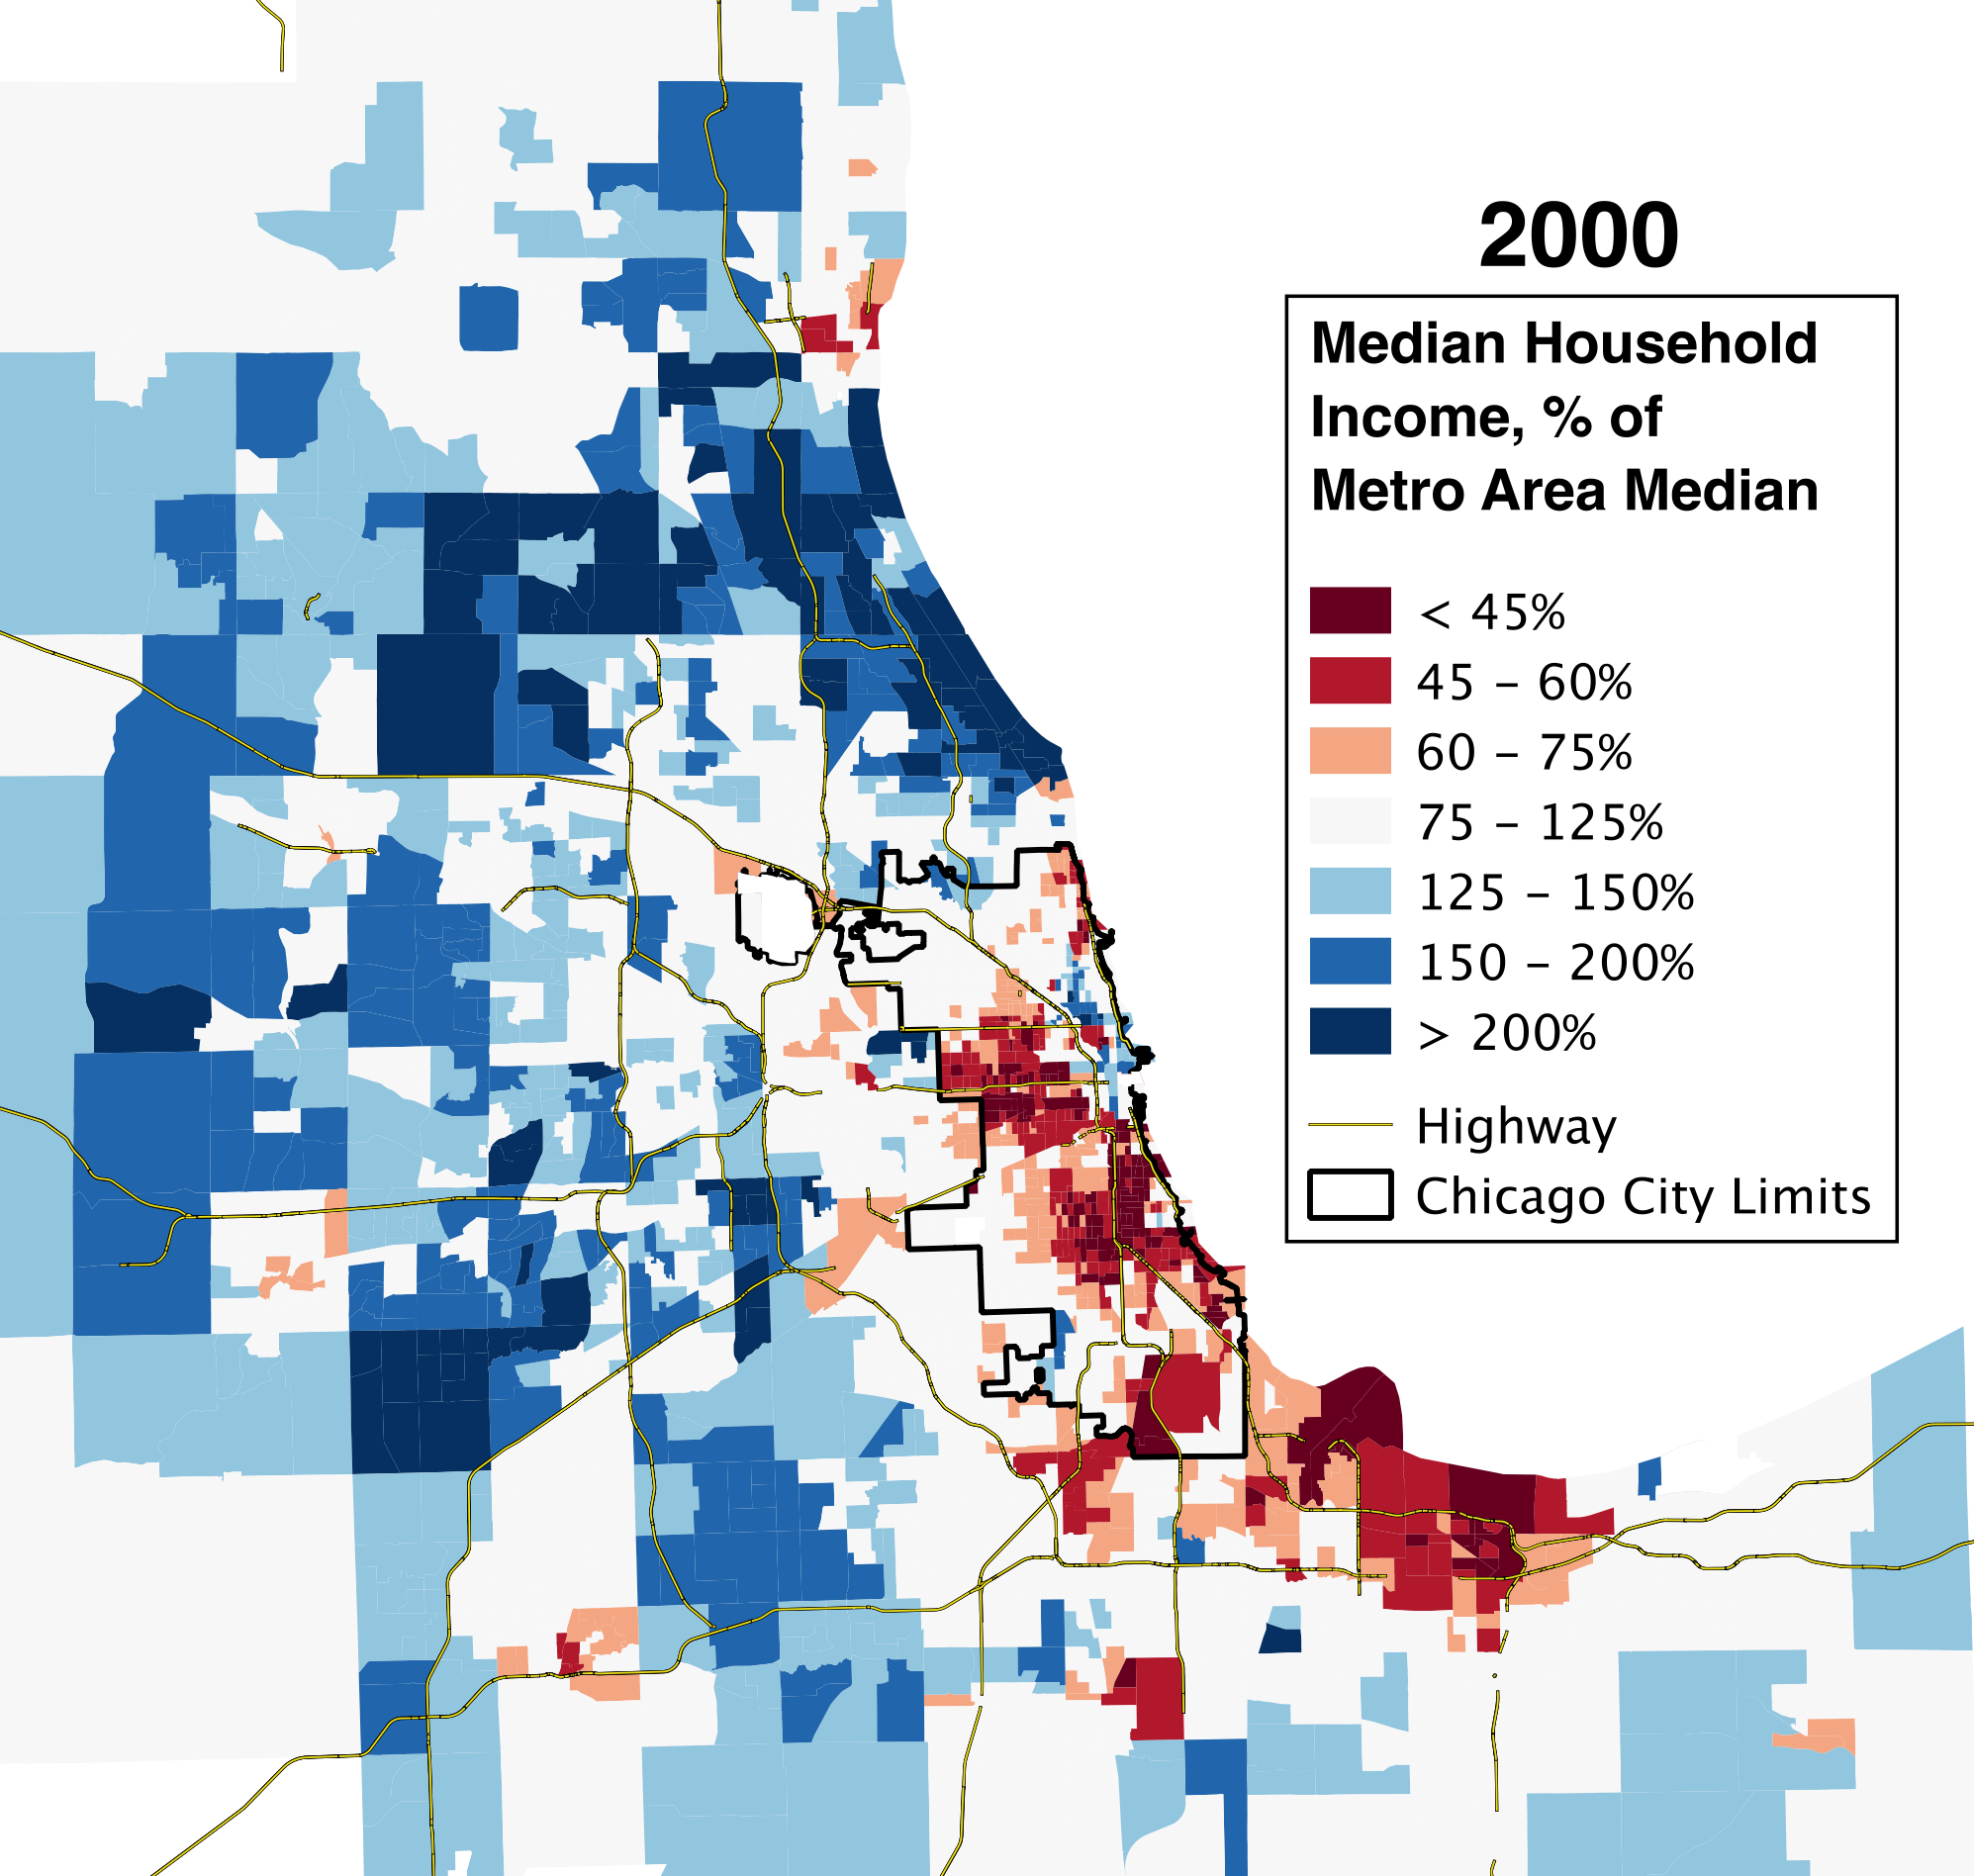
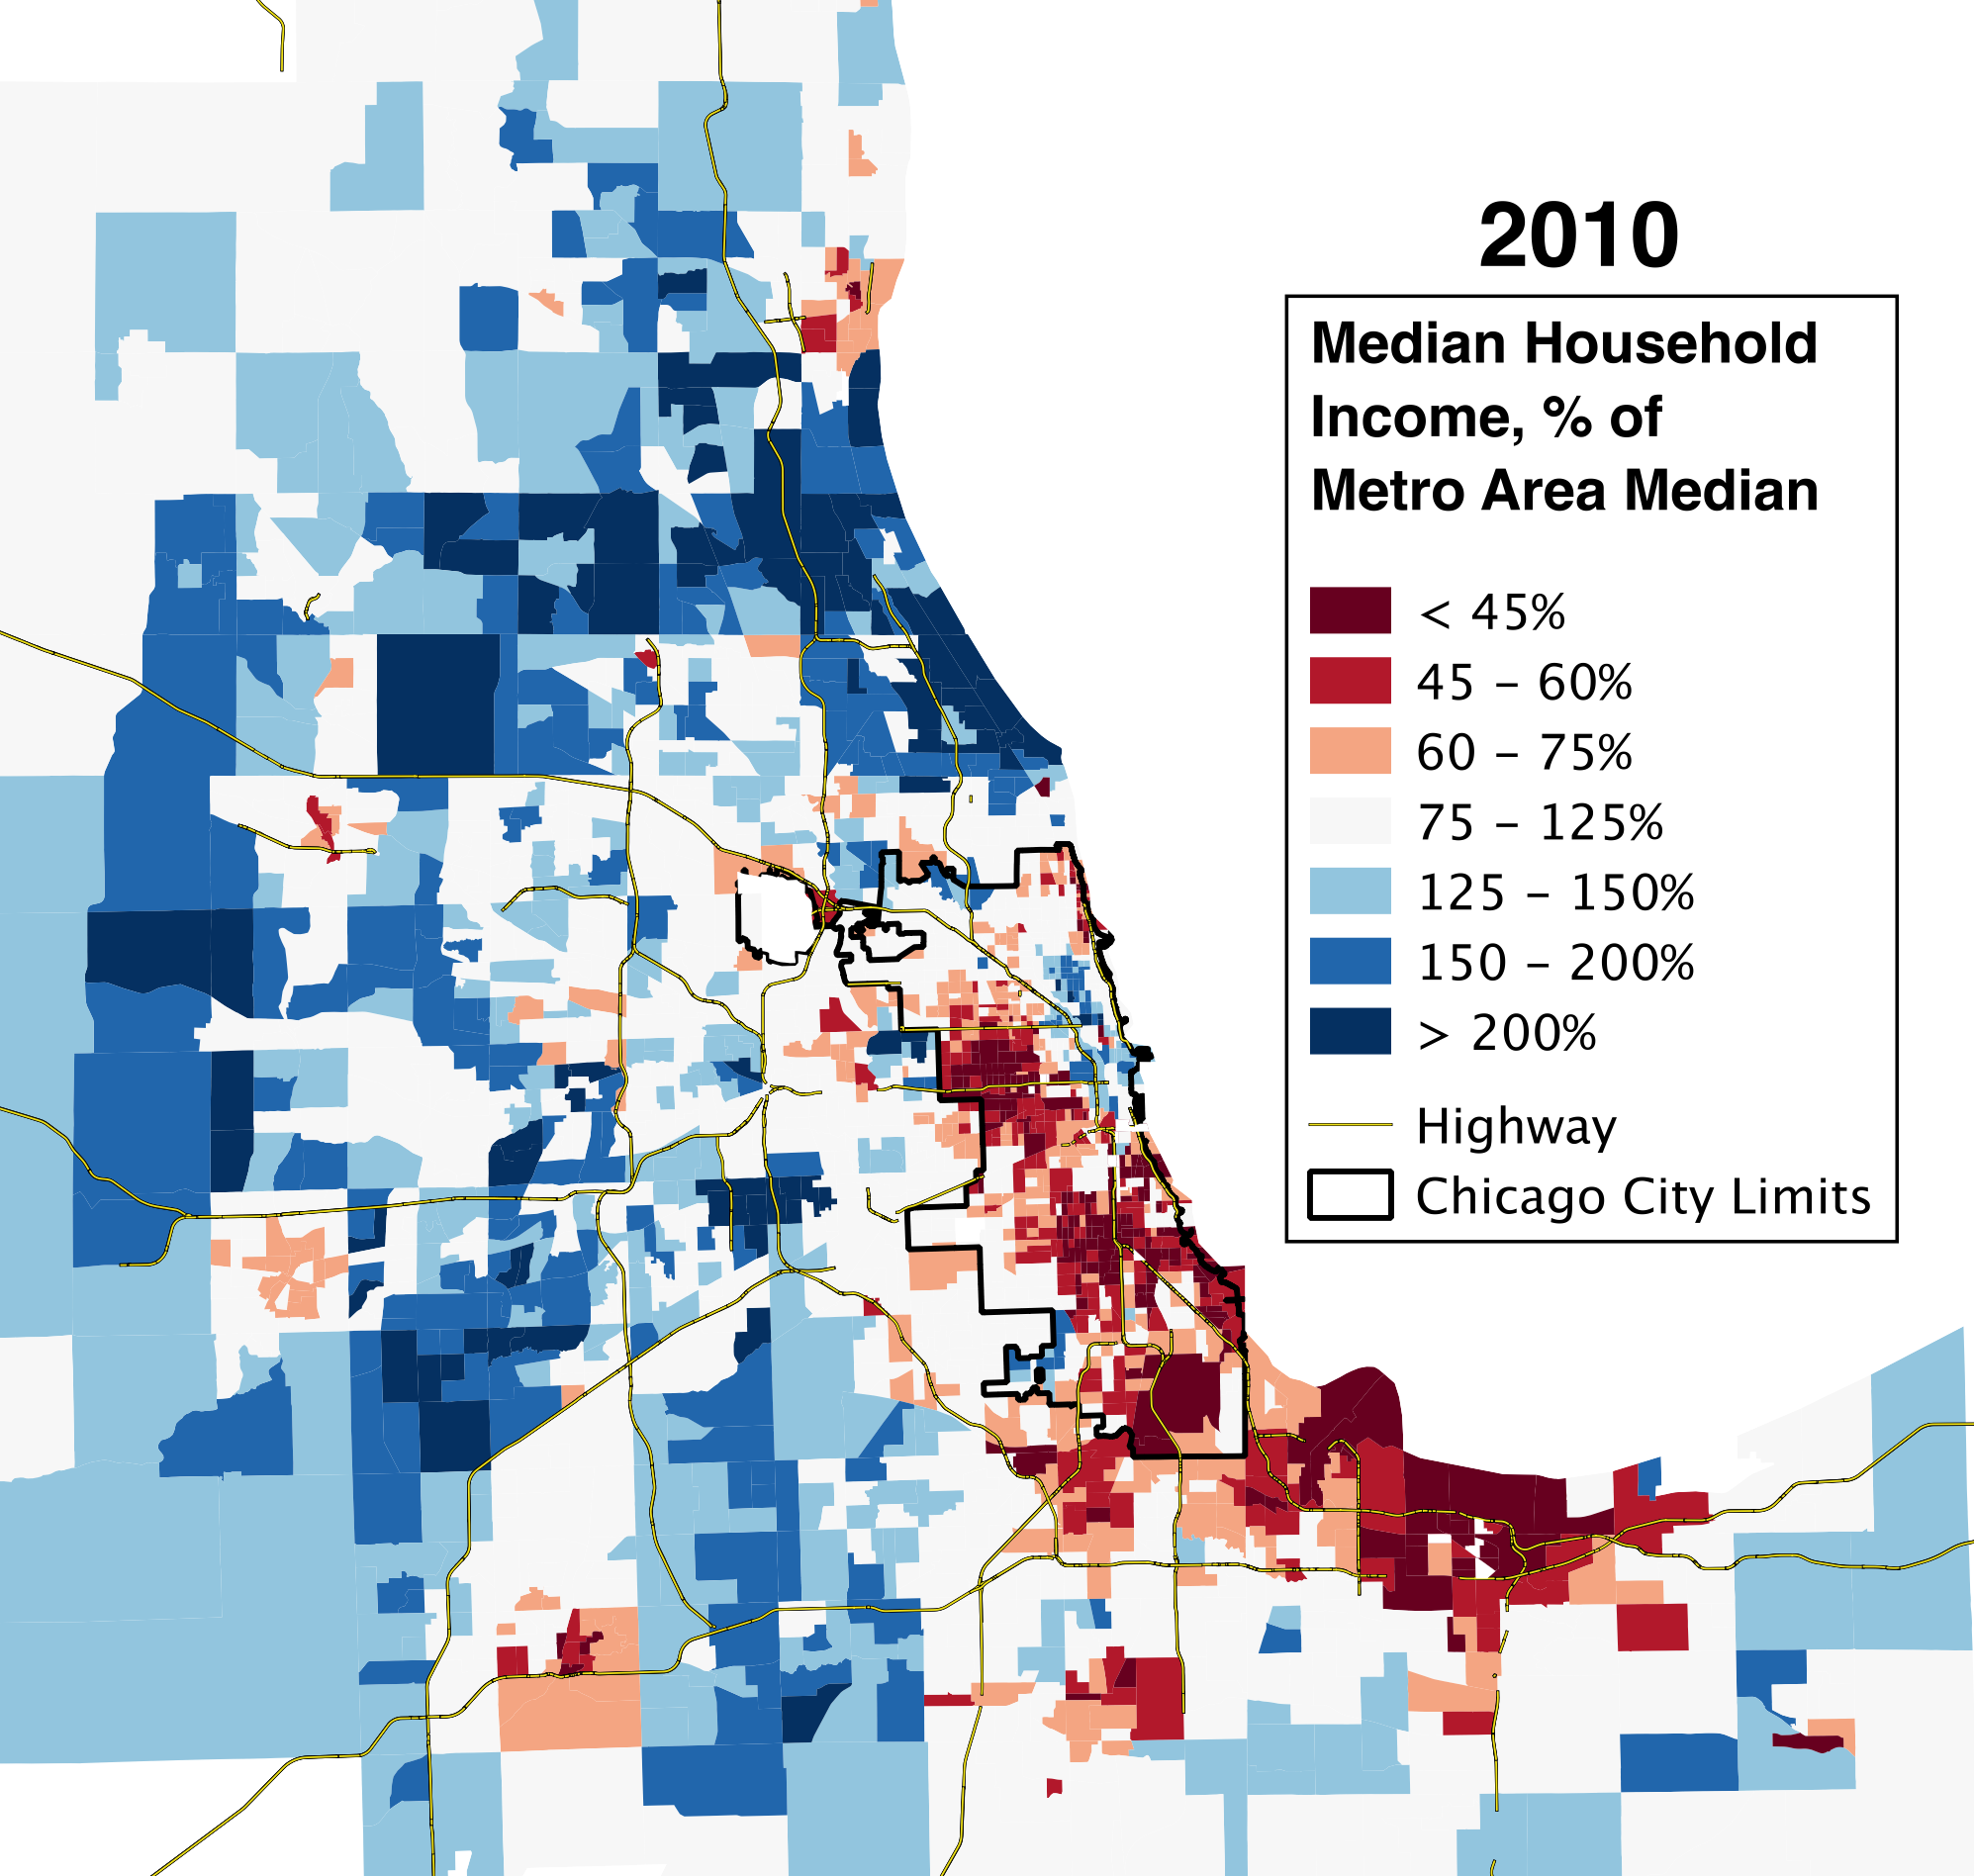
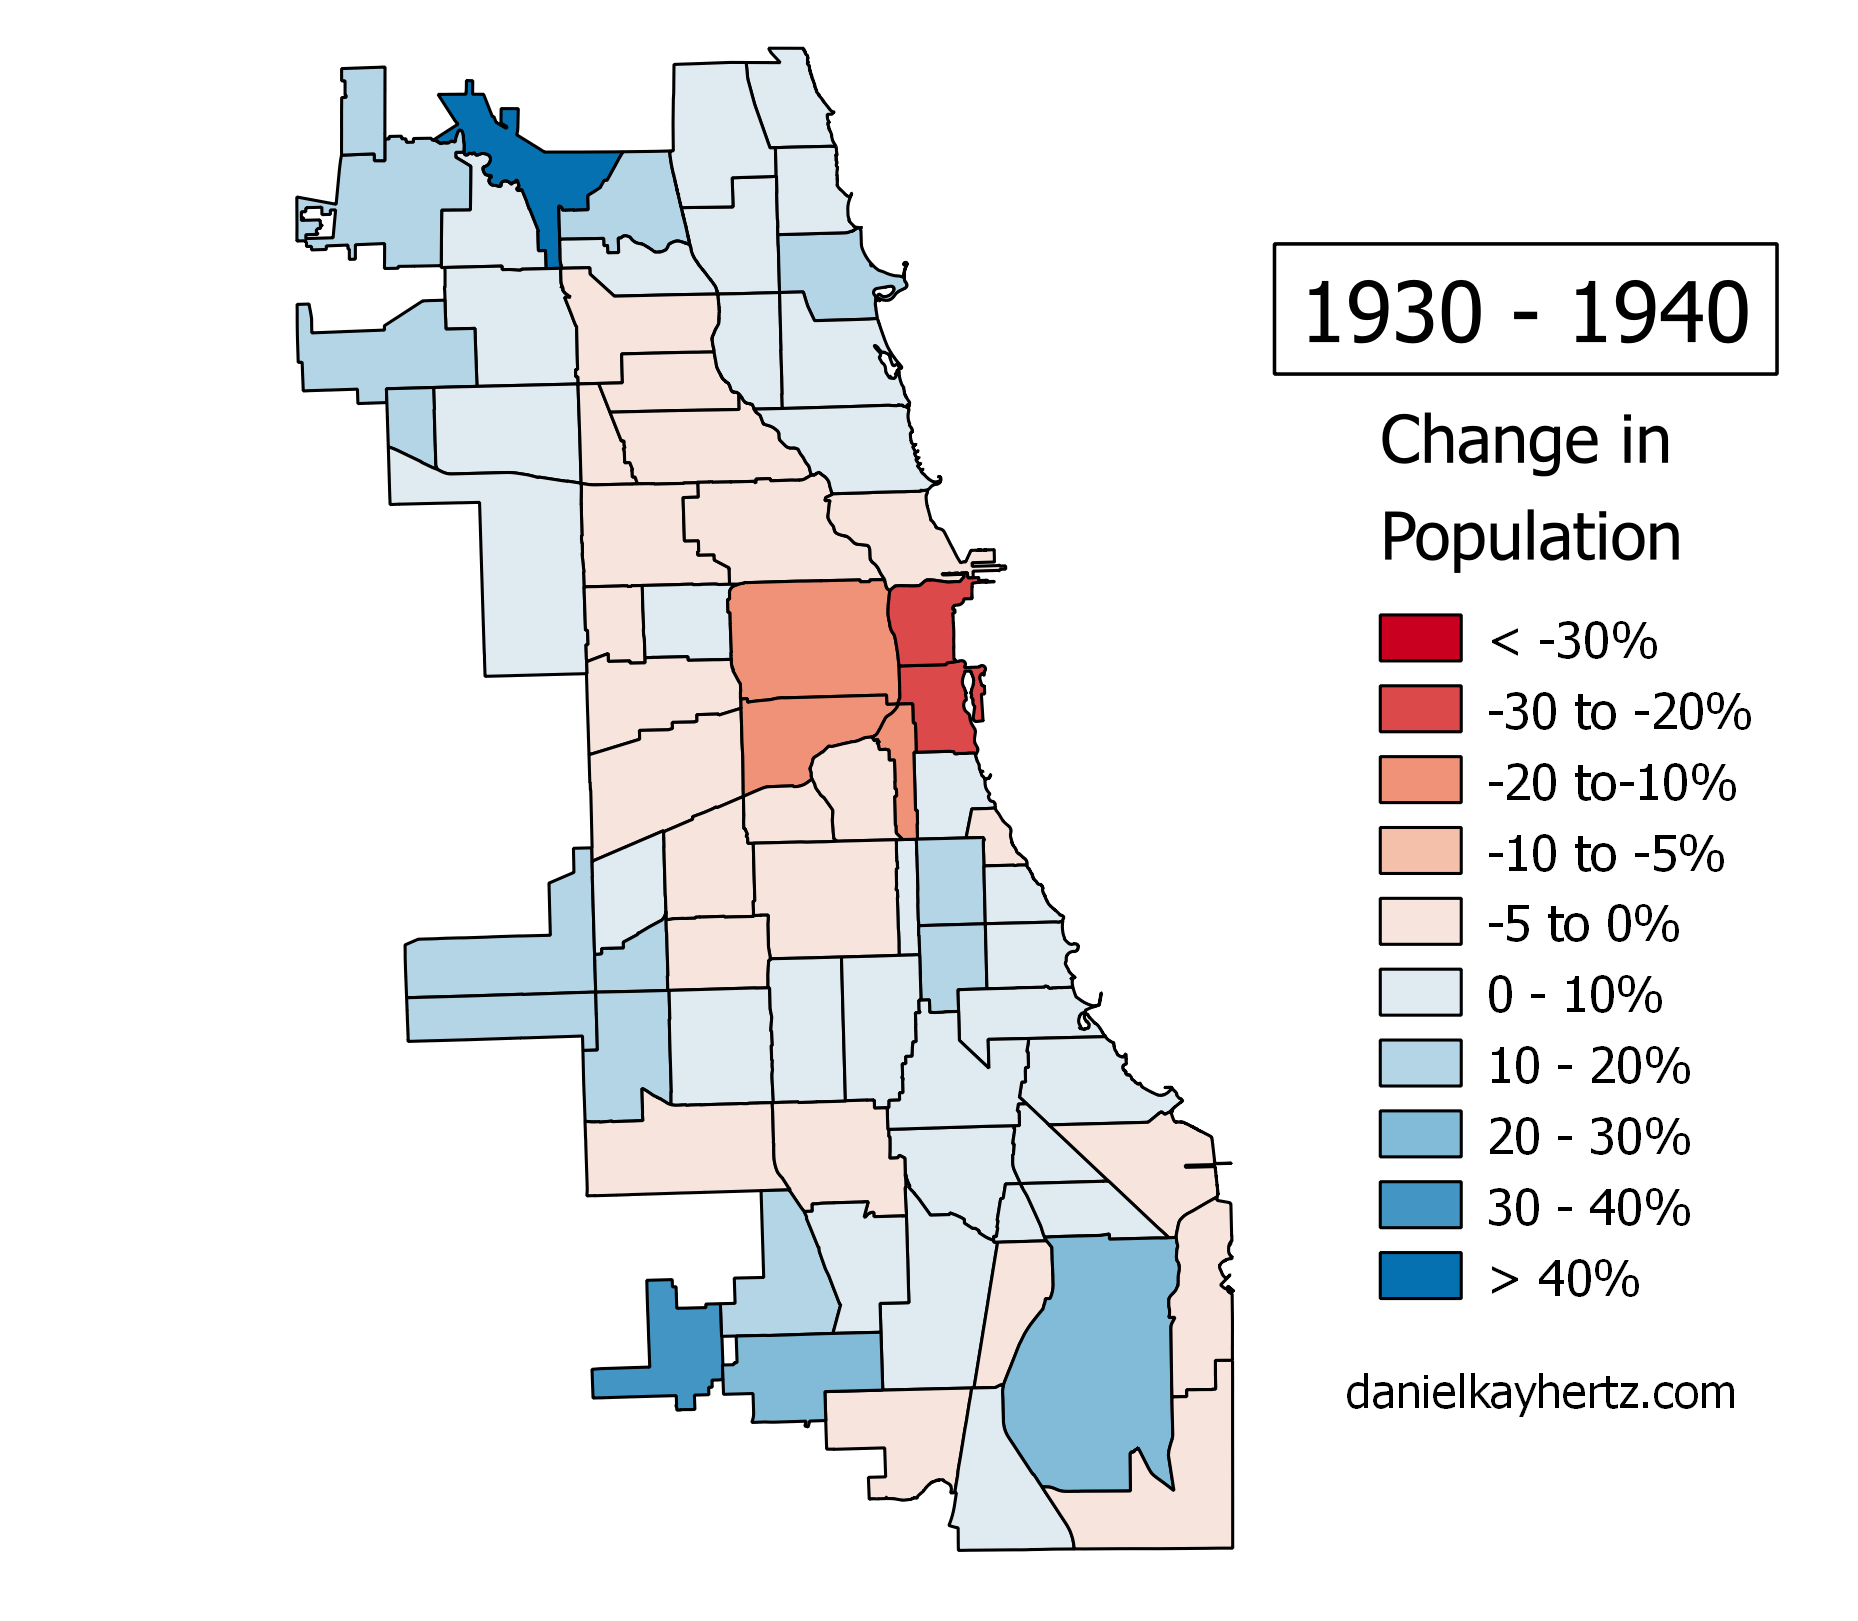
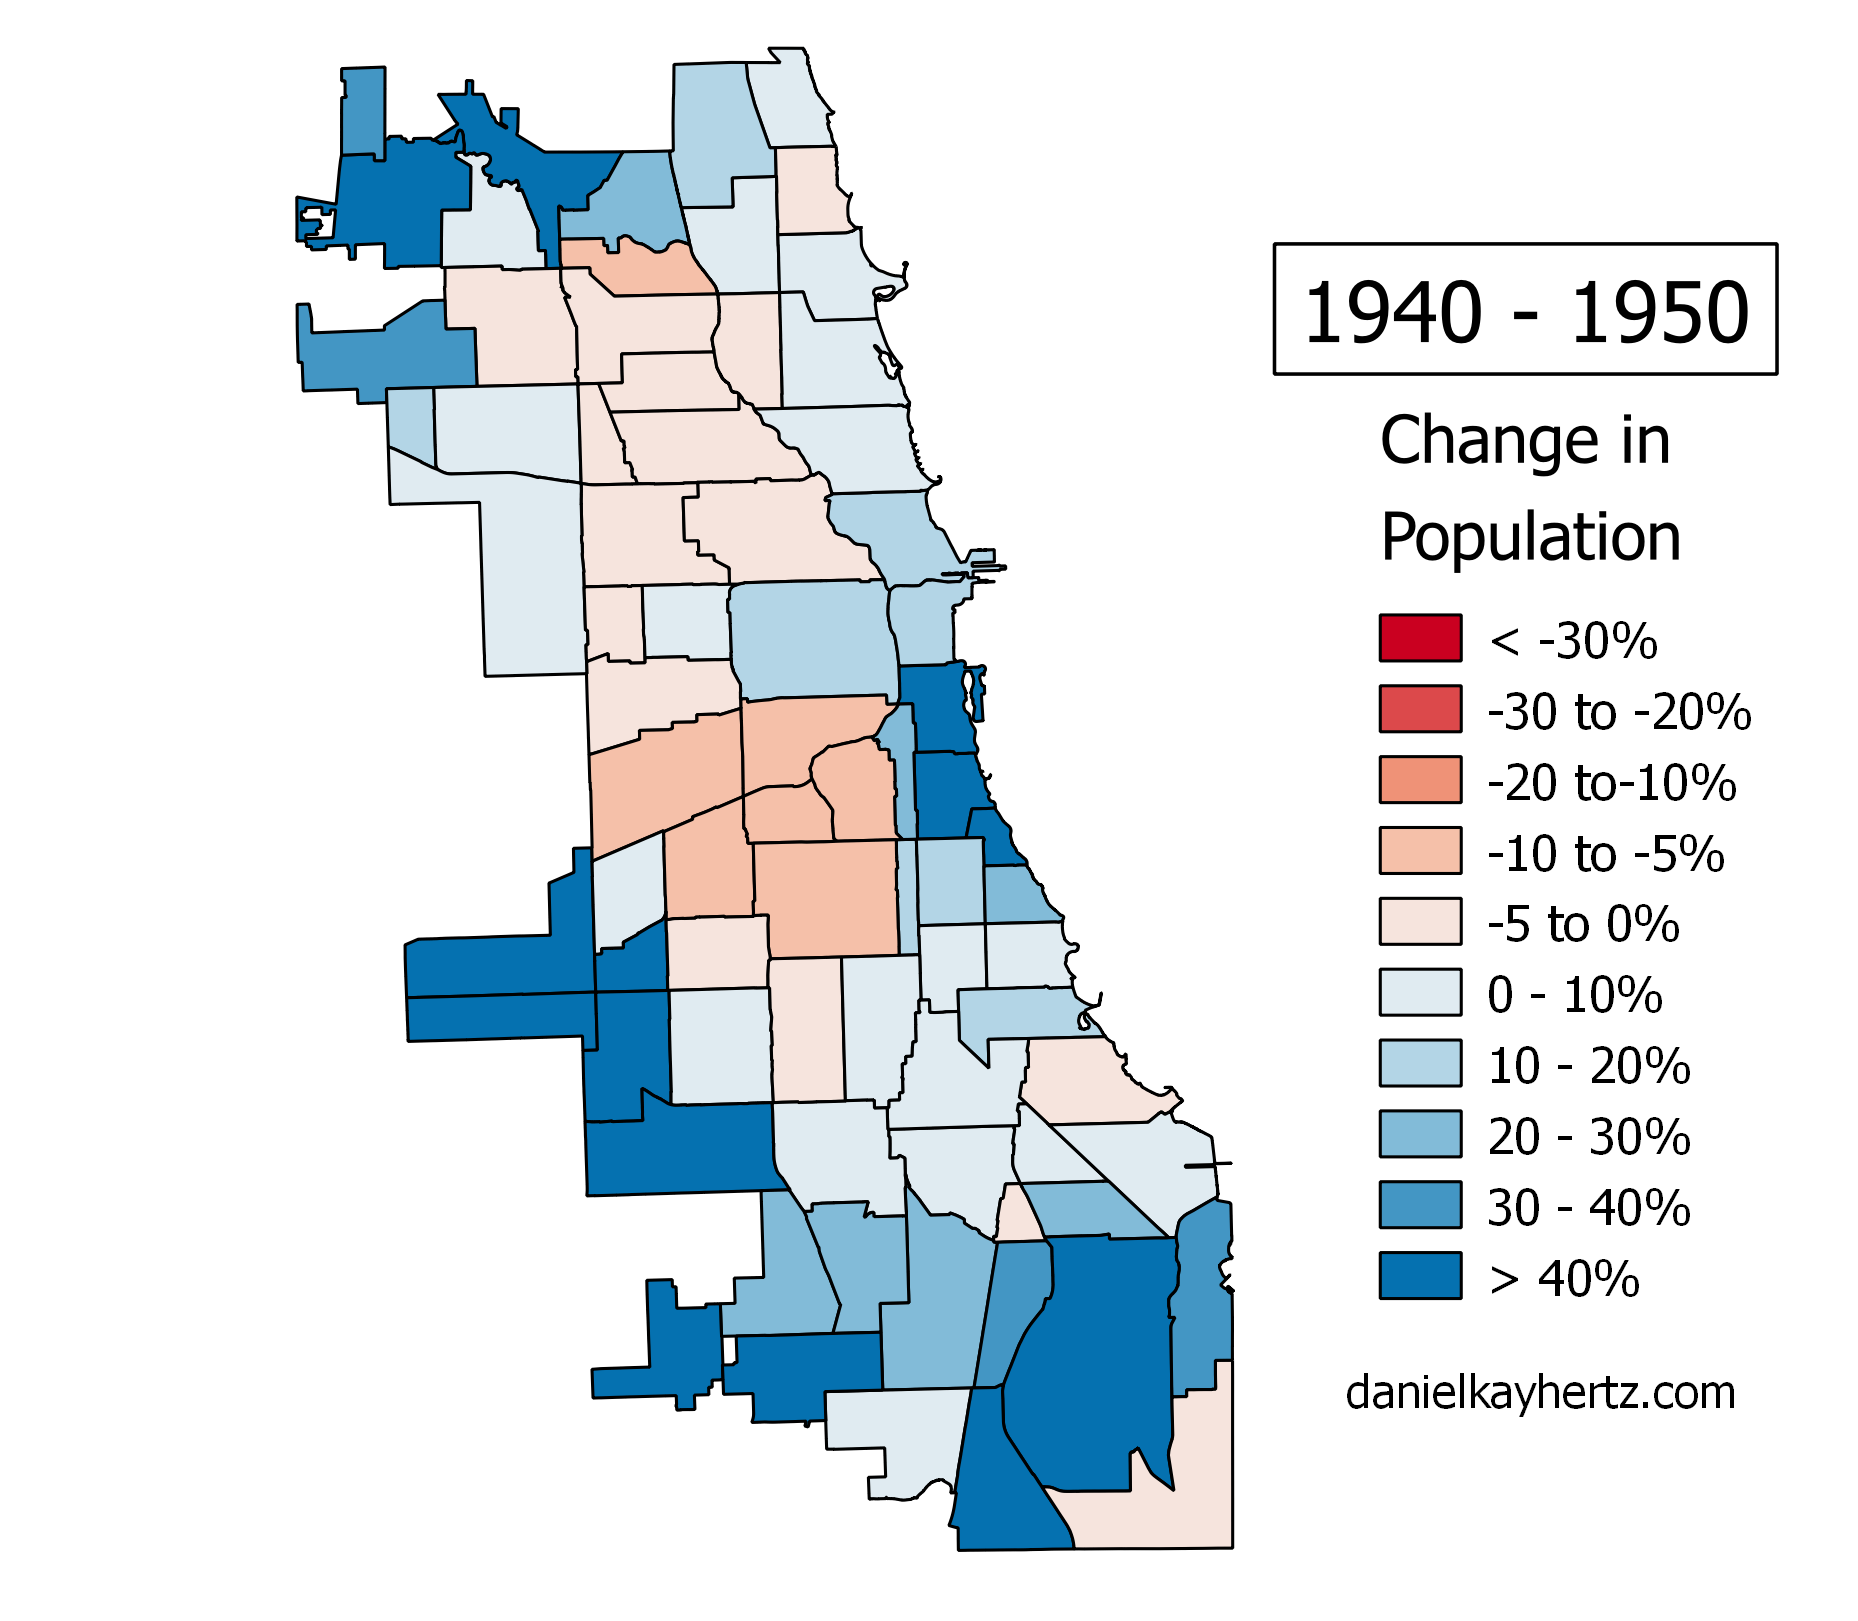
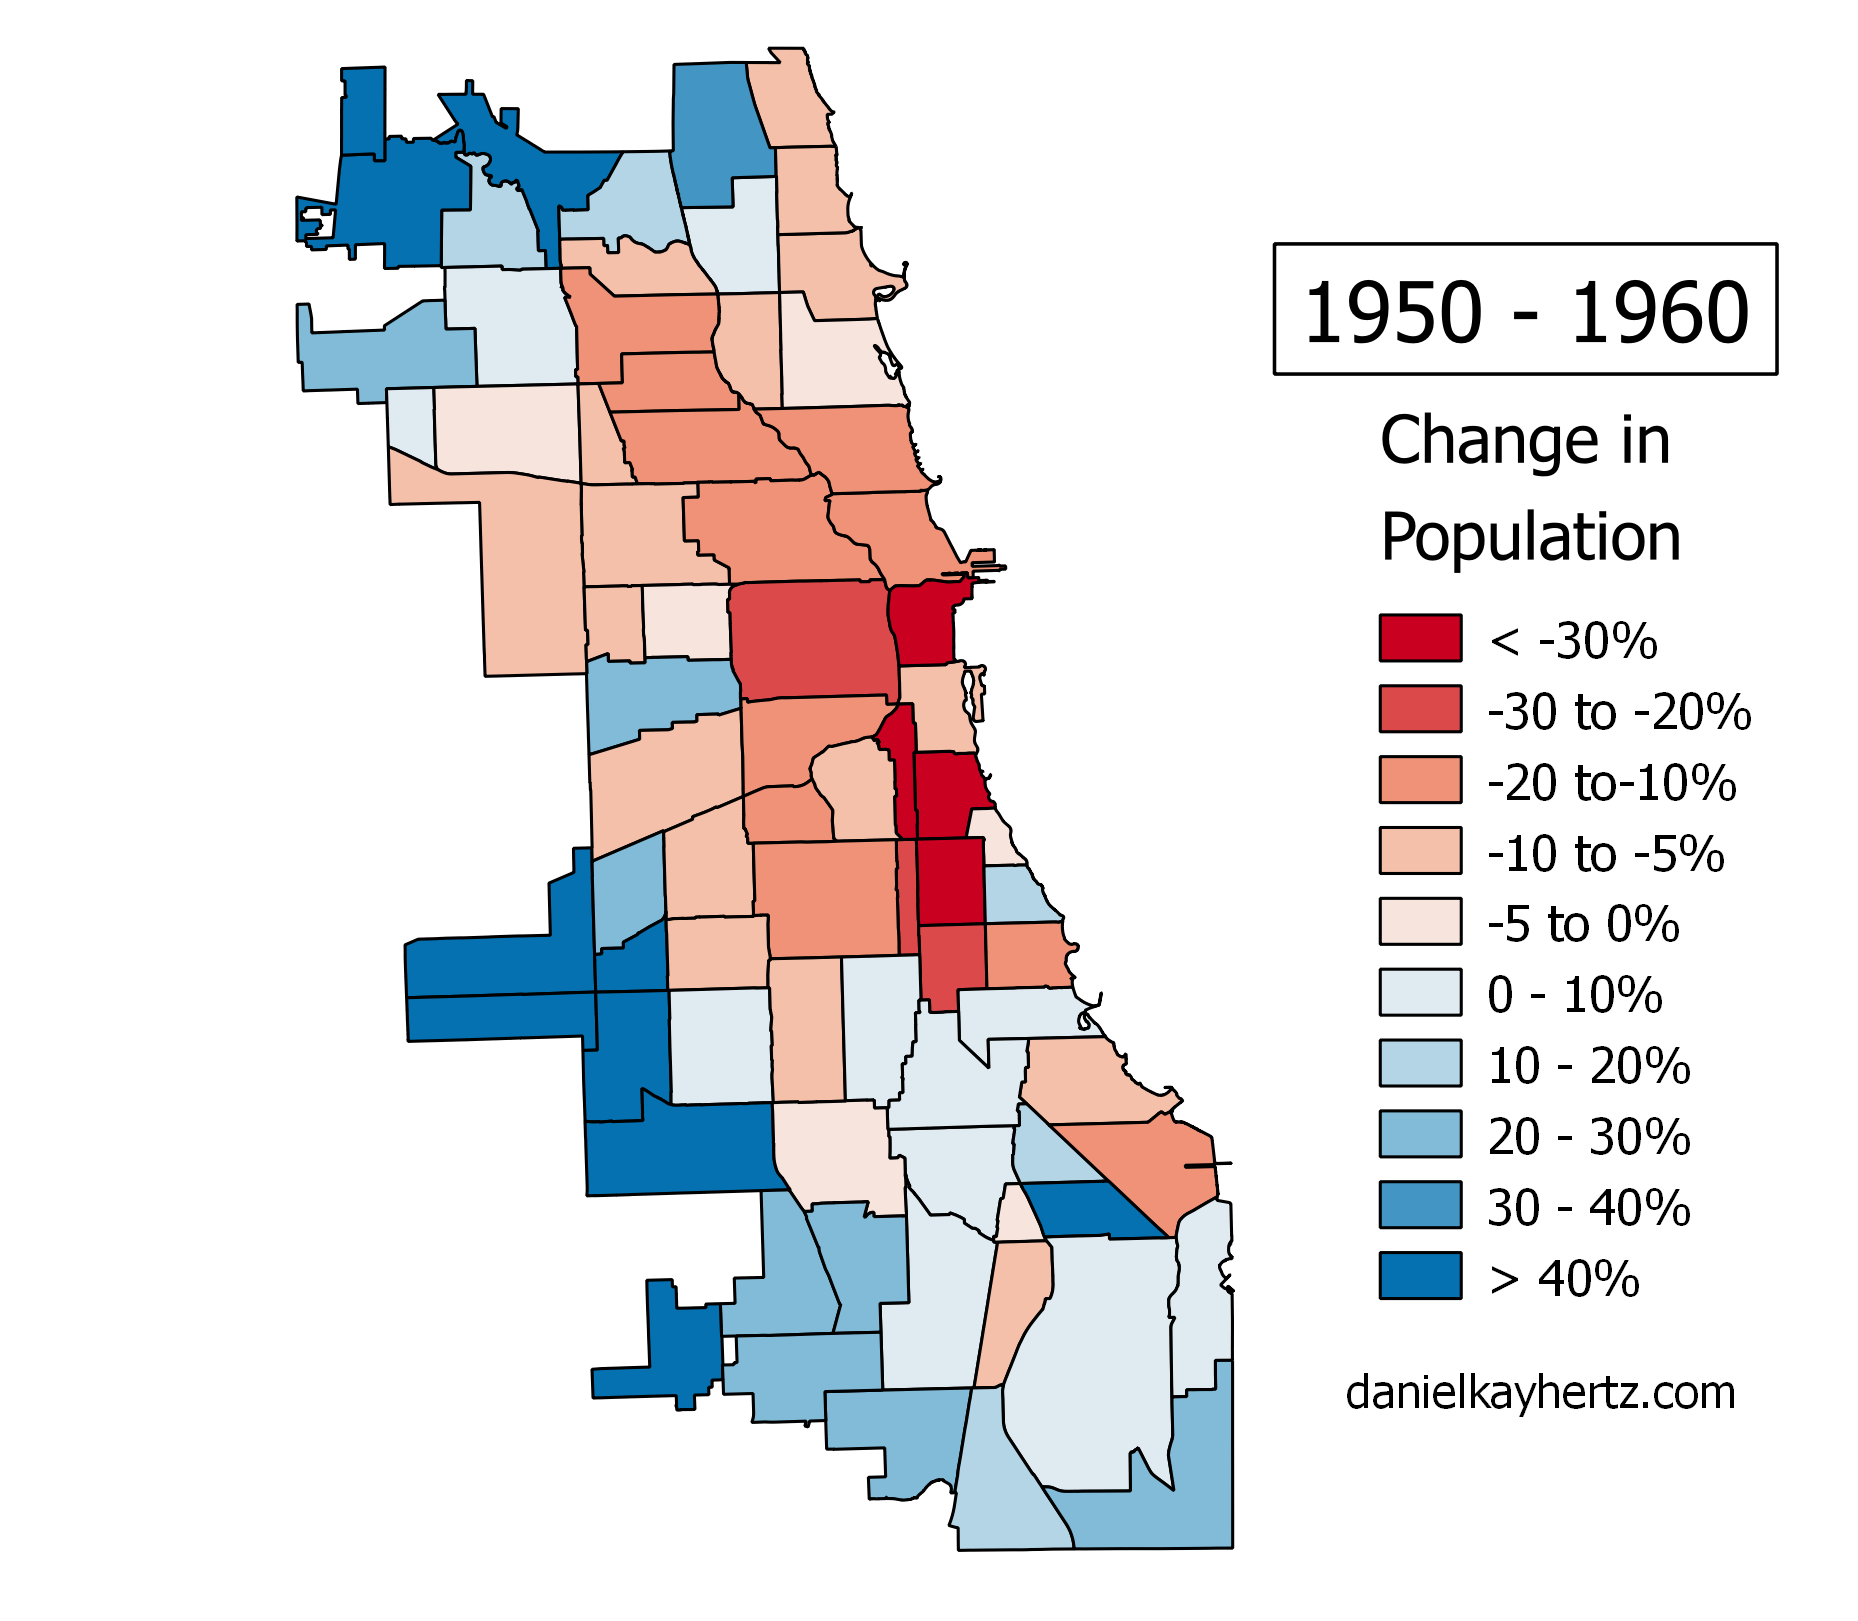
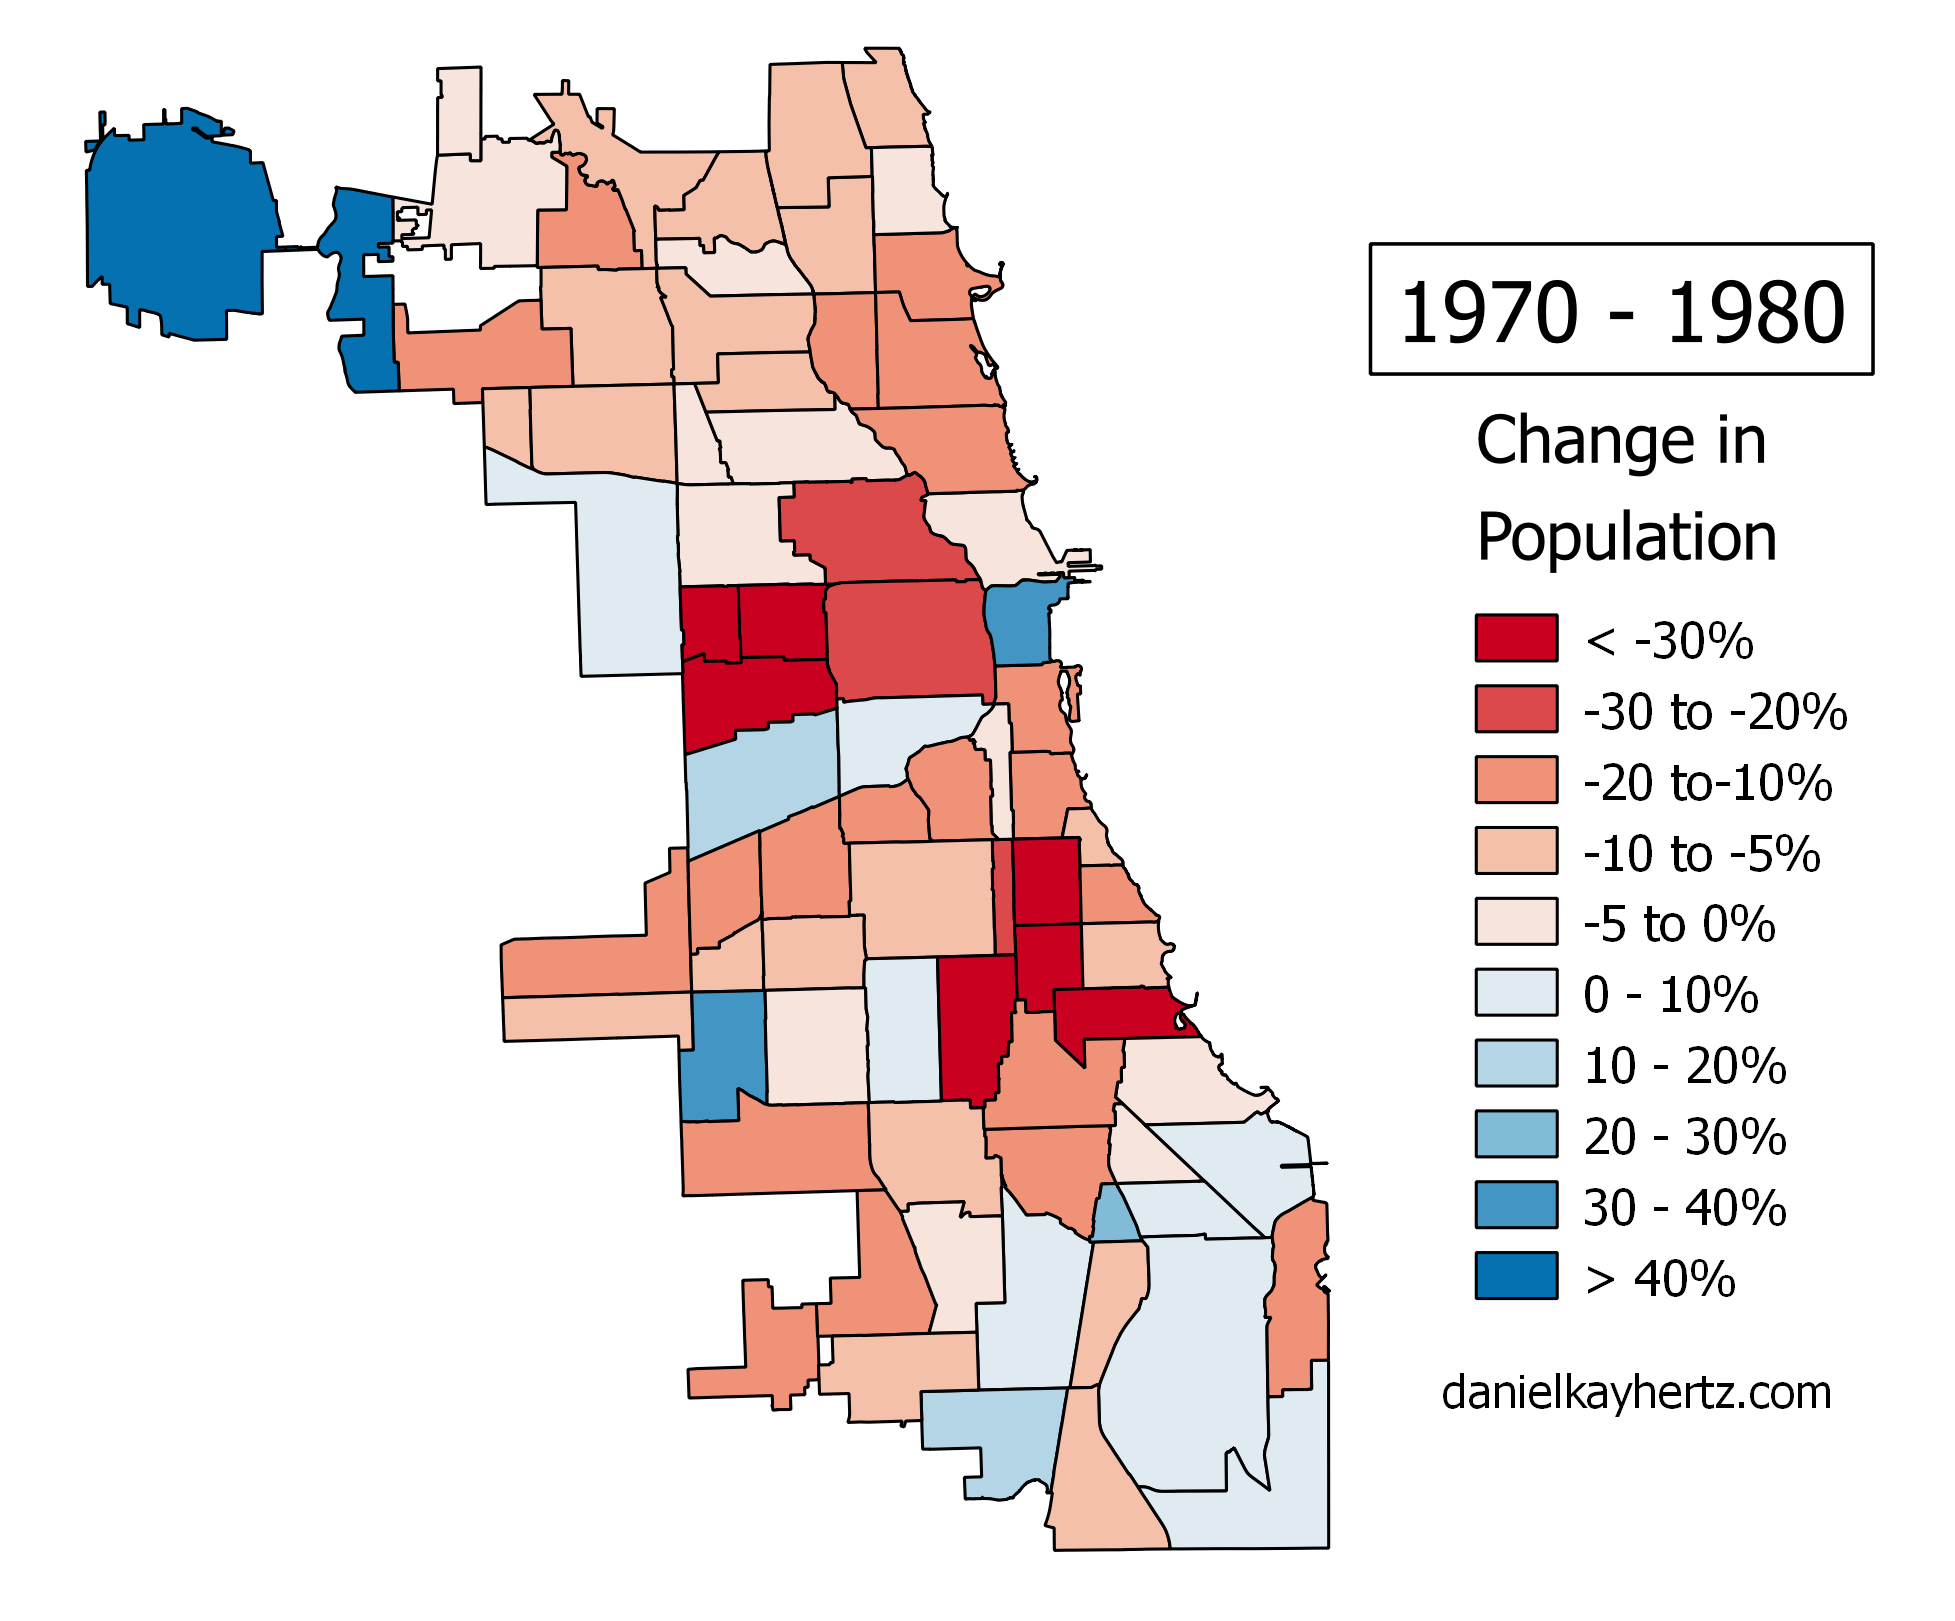
I think, on the one hand, that these regional maps show something very much like what Aaron Renn has described as a “new donut” pattern of urban wealth: a rich center, a ring of disinvestment, and then another outer ring of wealth in the outer suburbs. Importantly, though, I think these show that there’s nothing really “new” about this pattern – instead, the rings have existed since at least 1970, and have simply been moving further and further out from the center of the city.

Even in the first map, there’s a kernel of wealth around the Gold Coast, surrounded by extreme disinvestment, surrounded by middle-class neighborhoods, surrounded by relatively wealthy ones. In each succeeding decade, the general pattern is for the kernel of wealth to gentrify a bit of the surrounding disinvested neighborhoods; for middle-class areas adjacent to disinvestment to decline into disinvestment; for relatively wealthy areas adjacent to the middle-class ring to slip down a bit; and for some parts of the periphery to become more wealthy.

It’s a pattern that, if you’ve read Neil Smith on the rent gap theory of gentrification, makes a lot of sense. The idea is that waves of investment, disinvestment, and reinvestment in urban neighborhoods are driven by the semi-permanent nature of buildings themselves. In the beginning, say, someone builds a three-flat in a neighborhood near downtown. When it’s brand-new, it’s a highly desirable place to live, but over time, things deteriorate a bit, and newer construction further out steals away the high-income residents who can afford housing with better technology and more up-to-date styles. Importantly, the aging three-flat is not torn down or significantly renovated, because the difference between what the owner can actually charge, and what they could charge if it were a brand-new building, is smaller than the cost of demolishing the property and actually constructing a new property (or a gut rehab).

(That is: If you earn $10,000 from a building you own, and could make $15,000 if you rebuilt/rehabbed it, but rebuilding/rehabbing costs $10,000, you won’t do it. Because, you know, you’d lose money.)

As it ages, the building itself becomes less and less desirable, and so the people living there become poorer and poorer; if the surrounding buildings were all built around the same time, then something similar is probably happening in the neighborhood at large. But at some point, the calculation changes: the building becomes so low-rent that the extra income an owner could get if it were brand new is more than the cost of replacing it. (It might also be the case, of course, that the building’s rent hasn’t fallen that much more, but the value of a new/rehabbed building has increased a lot – if, say, the three-flat is in a neighborhood near other neighborhoods that have seen an increase in amenities and jobs.) At that point, since it’s profitable to do so, the owner will do a major rehab or reconstruction, and gentrification begins.

(That is: If, from the previous example, the $10,000 you’re earning dwindles to $4,000, all of a sudden rebuilding/rehabbing becomes profitable. Alternatively, if you’re still making $10,000, but a rebuilt/rehabbed building would give you $25,000 – again, rebuilding/rehabbing becomes profitable.)

For example: these townhomes in Logan Square. Credit: YoChicago

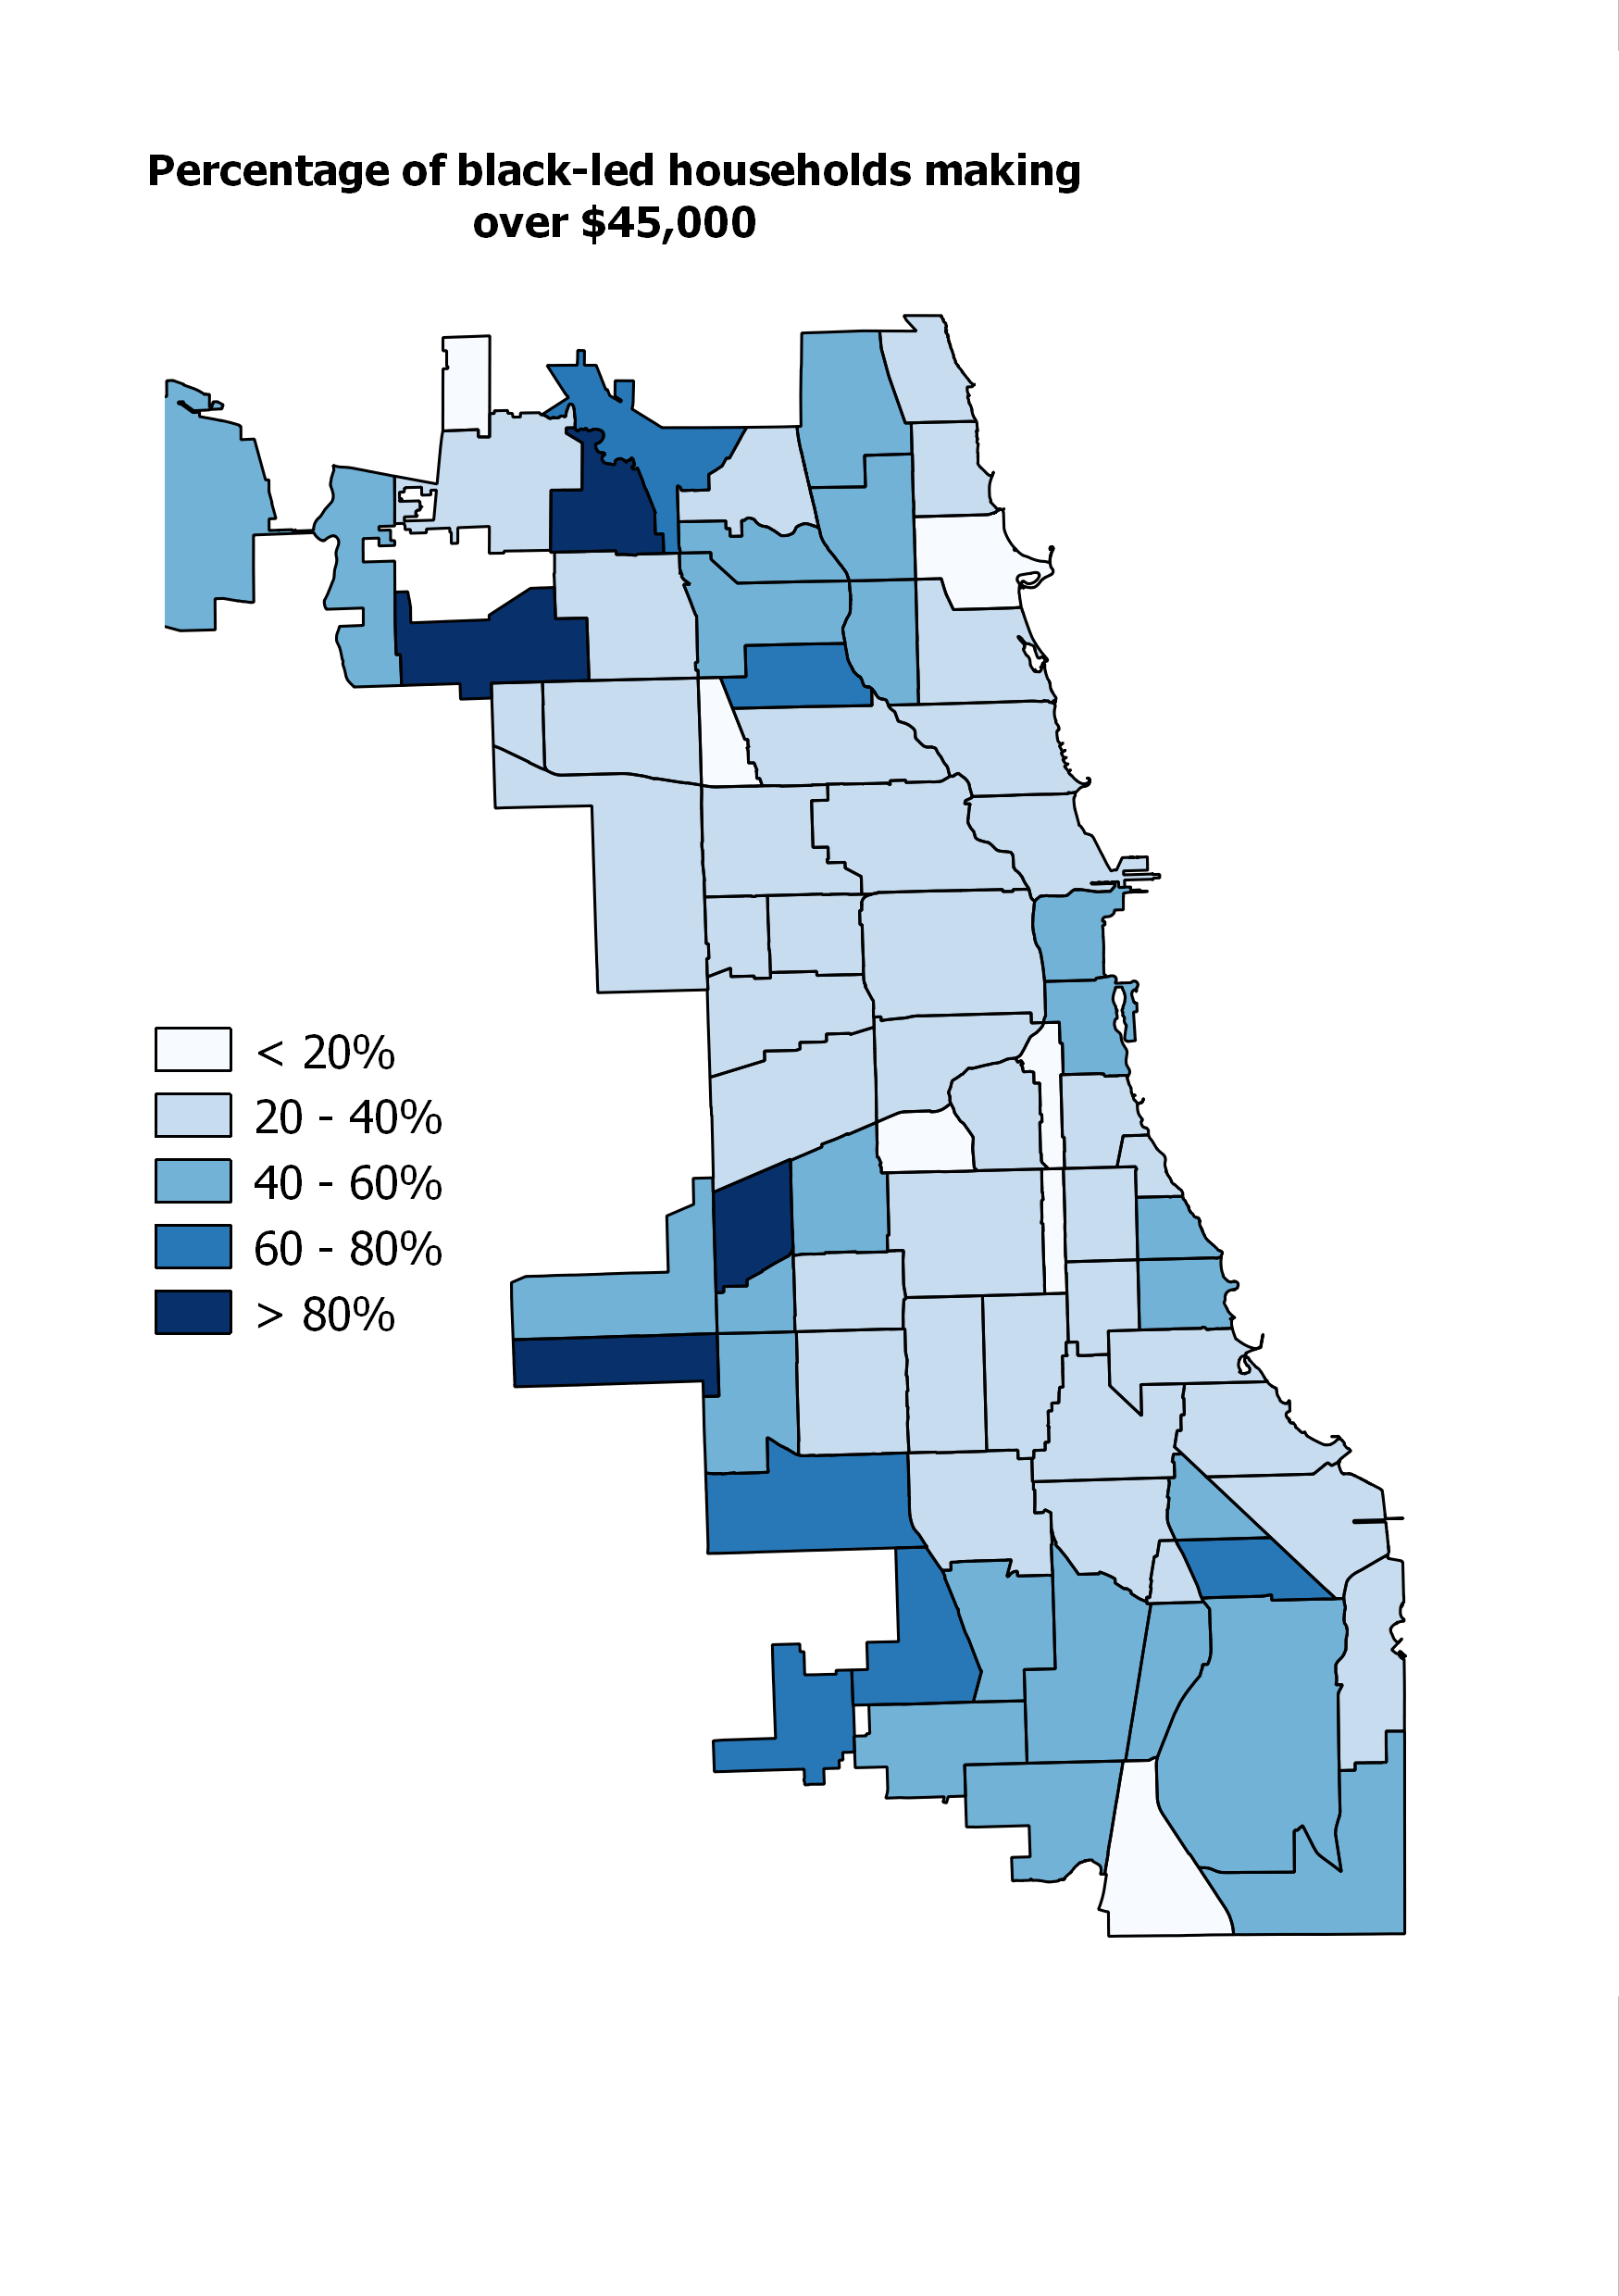
As I said, to a large extent, I think this describes what’s going on here. But anyone familiar with Chicago’s racial geography will have already noted that there’s something else, too. (If you’re not: basically all of the deep-red areas are segregated black neighborhoods. A few are predominantly Latino.) Namely, black neighborhoods seem both to suffer much faster disinvestment than you see elsewhere, and to be less able to reach the reinvestment part of the cycle. Neither of those things are news – there have been several reports about how “black neighborhoods don’t gentrify” already this year – but I think it’s particularly striking in this context. It’s not just that black neighborhoods don’t gentrify: it’s that anti-black racism is so strong that it overcomes, and arrests, the regional pattern of disinvestment and reinvestment.

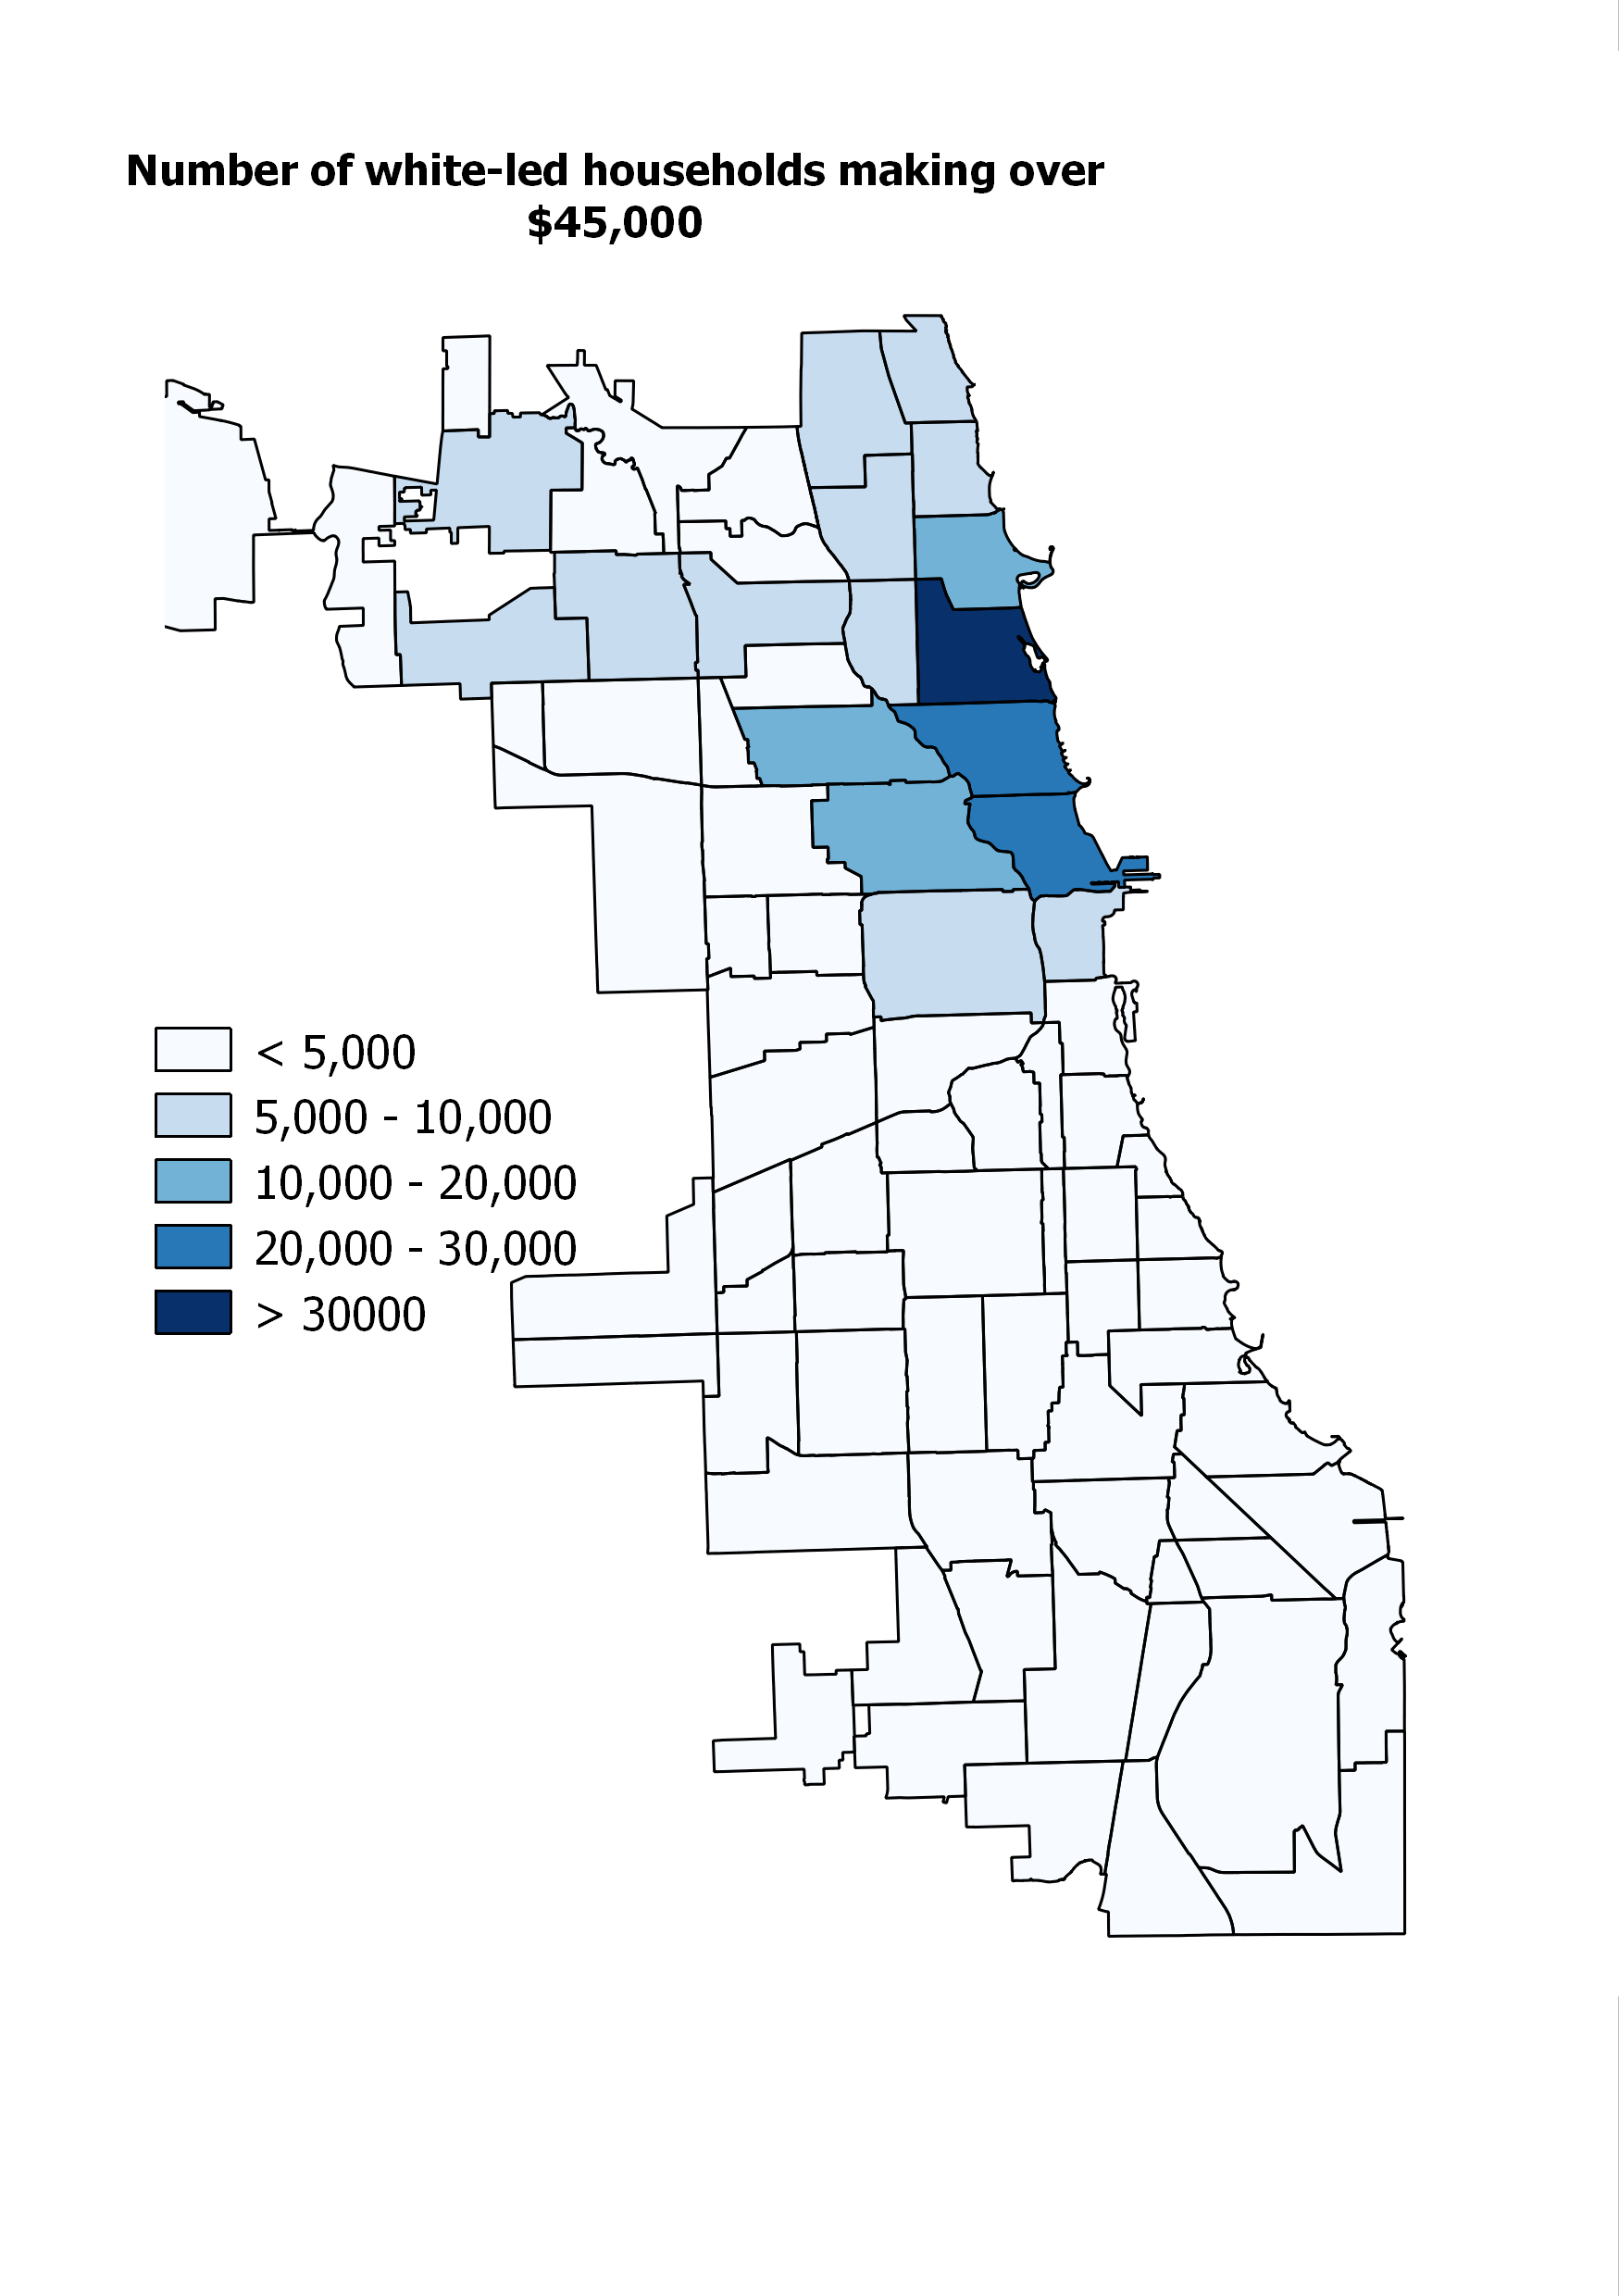
Or consider the problem from a different perspective. Some people have described gentrification as a process of “racial arbitrage.” Arbitrage, more commonly, refers to someone profiting by taking advantage of the fact that the same good has different prices in different places. (For example, you might buy cheap cigarettes in Indiana and sell them at a markup in Illinois, where taxes make cigarettes much more expensive.) In this view, some disinvested neighborhoods aren’t just cheap because their housing has deteriorated; they’re cheap because most of the people who live there are non-white, which makes white people not want to live there. Since white people make up a large number of buyers in the housing market, that means demand crashes, and so do prices.

But that also means that if you’re one of the few white people who doesn’t care about living around people of color, you can save a bunch of money by moving to a non-white neighborhood of roughly equal “quality” (whatever that means for you). Each additional white person who does so, however, makes the neighborhood that much whiter – and as a result, that much more comfortable for the majority of white people. At some point, the neighborhood is white enough that most white people are willing to live there, which brings up both actual and “potential” housing prices, inviting a wave of reinvestment and more gentrification.

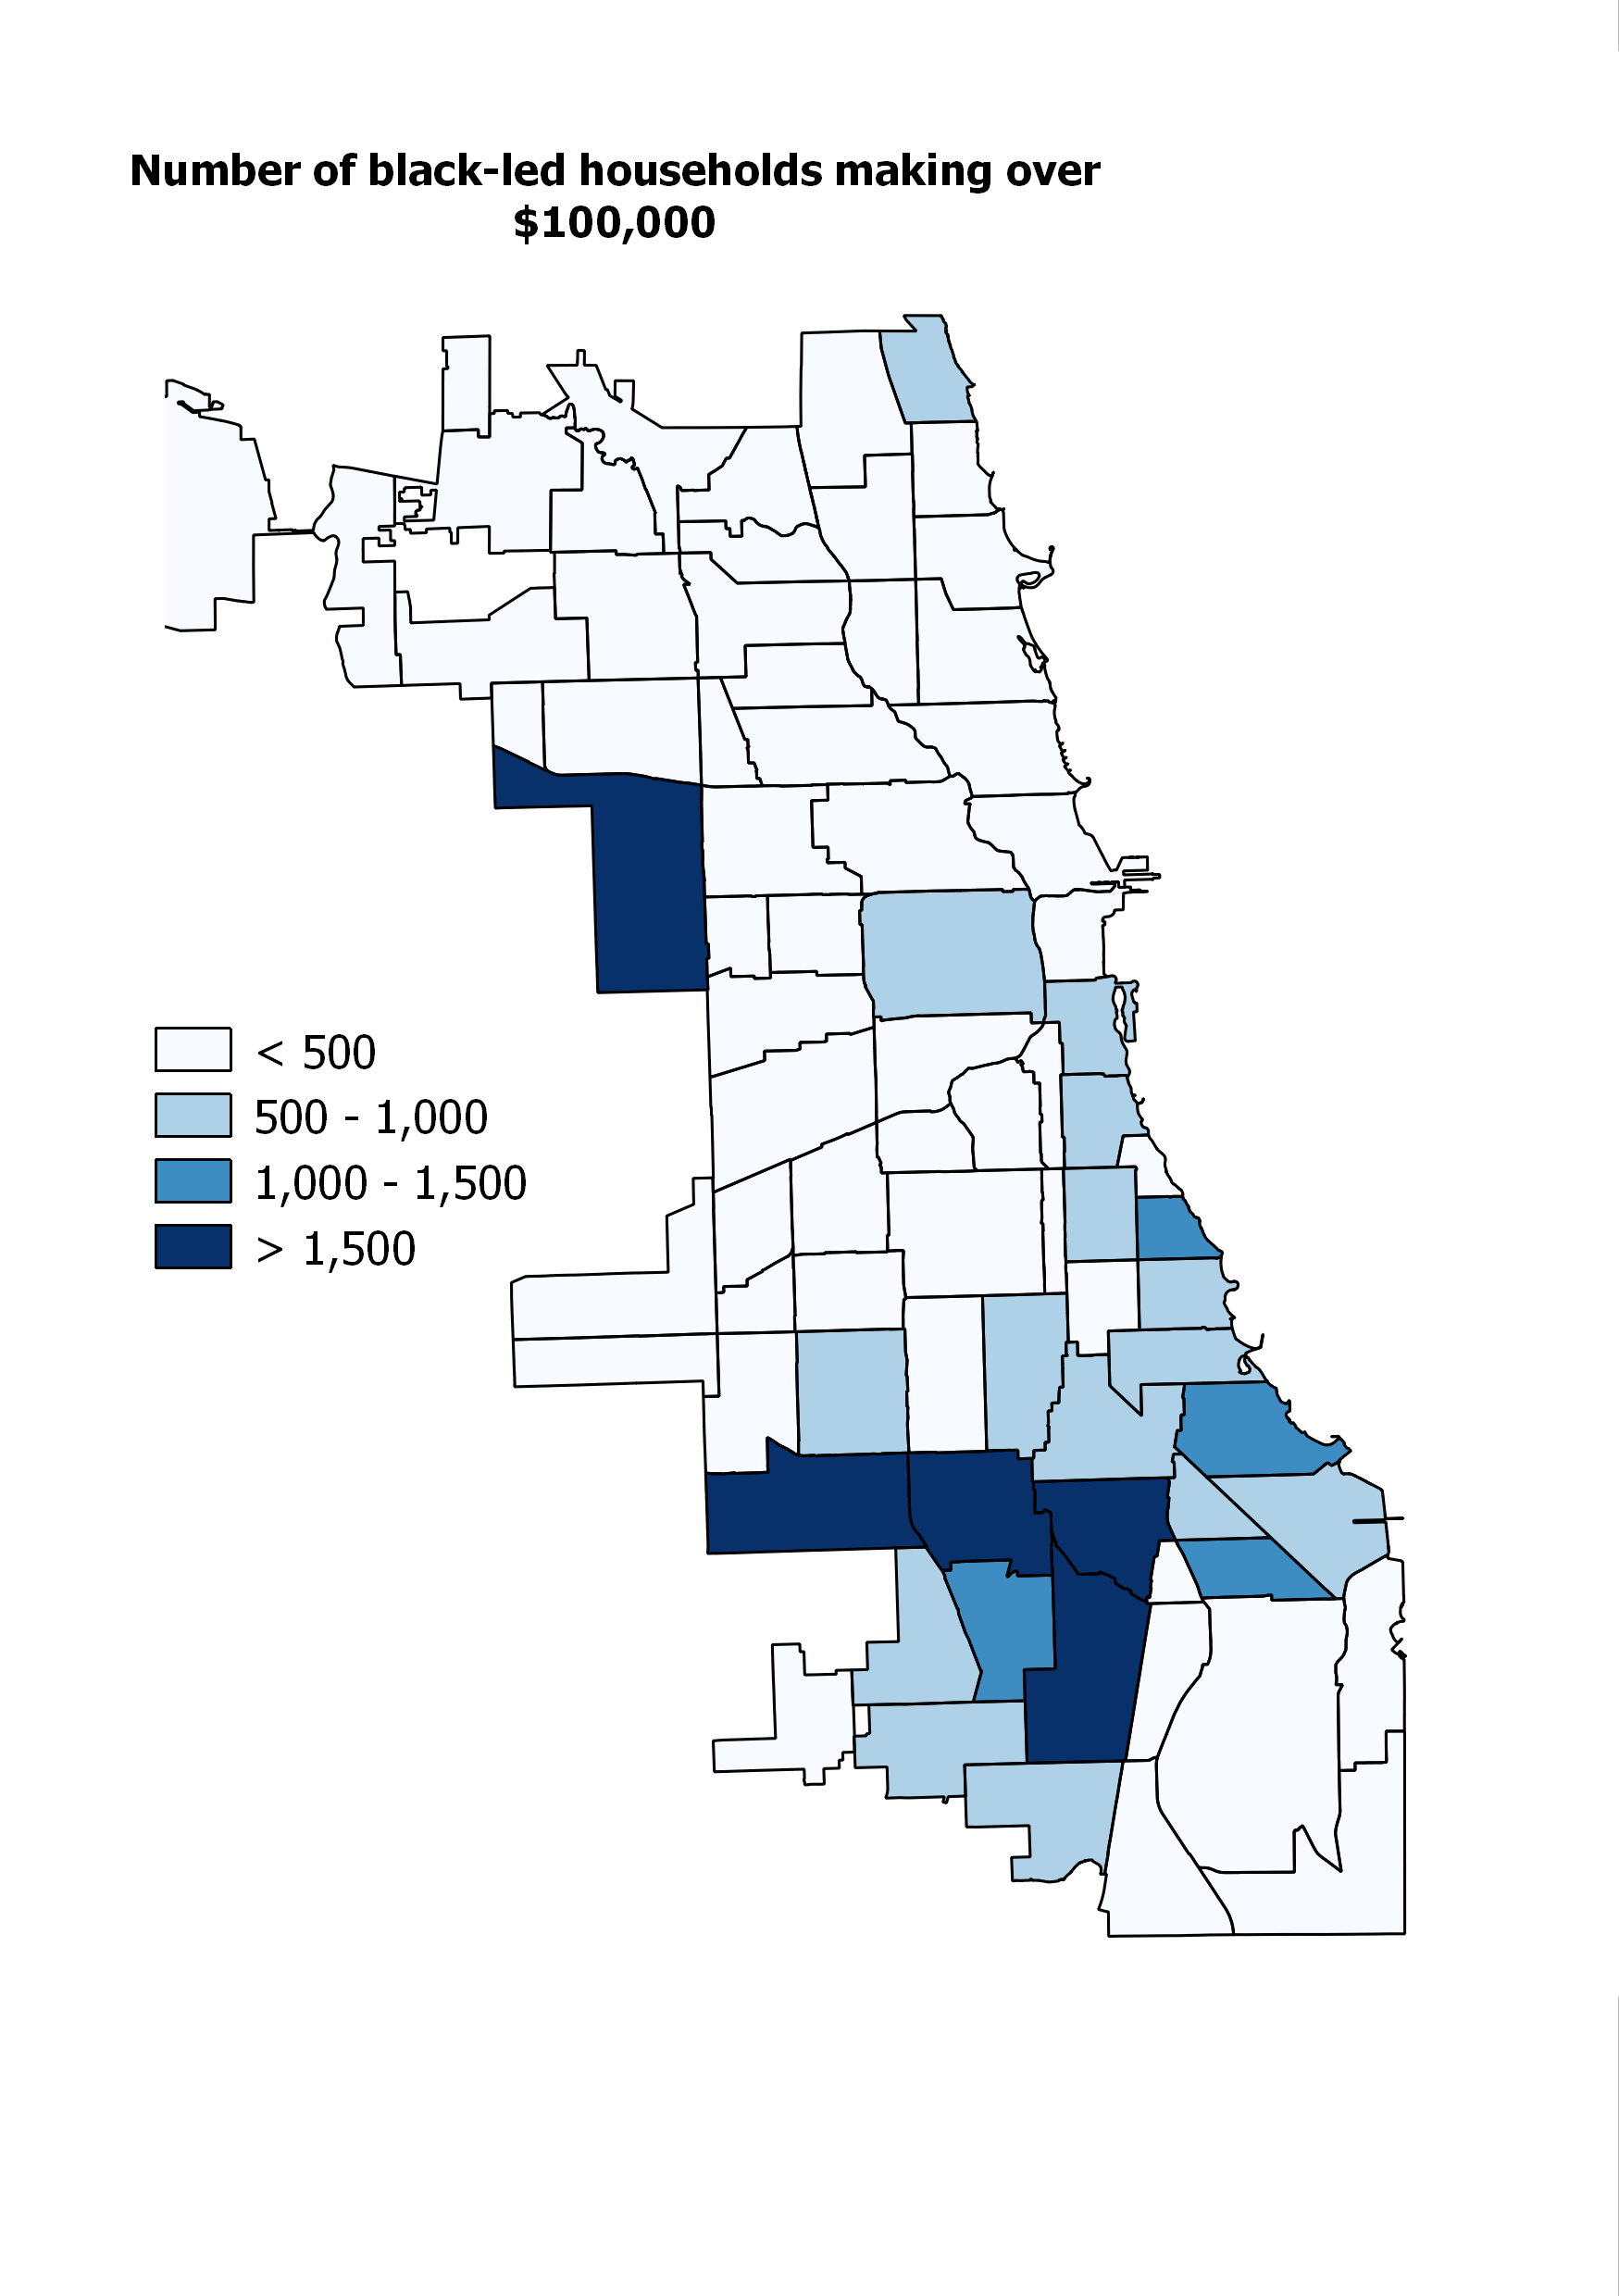
It appears, though, that anti-black racism is so strong that there are virtually no white (or other non-black) people willing to move into black neighborhoods, even if it means saving a lot of money. In other words, regardless of whether you think this is good or bad, racial arbitrage doesn’t work in black neighborhoods. Even in places – northern Bronzeville, say – where proximity to jobs and transportation would make you think that it would be an attractive option, there is vanishingly little evidence for it. As a result, potential rents depend entirely on the purchasing power of a disproportionately poor quarter of the population, and stay relatively low.

As Pete Saunders has pointed out, many black South Side neighborhoods (like Chatham, pictured here) have a lot in common with working-class North Side communities.
Chatham demonstrates racial arbitrage fairly well: these bungalows would cost a good deal more in a similarly far-flung non-black neighborhood. Credit: YoChicago

These two concepts – the rent gap theory and the racial arbitrage theory – are both, I think, really helpful in understanding how Chicagoland’s economic geography has changed over the last 40 years, and how it’s likely to change in the future. The foundation is a tendency for an expanding donut-shaped ring of rich and poor neighborhoods as a result of cycles of investment and disinvestment in housing. On top of that – no less powerfully – are the consequences of racism, which have a number of effects. First, they accelerate disinvestment as white people and their resources flee non-whites, and as new non-white residents are discriminated against in the provision of retail outlets, public safety, functional schools, and so on. Second, they open up the possibility of racial arbitrage: that is, another way for “potential rents” to rise and attract reinvestment and gentrification. Third, for black neighborhoods in particular, they can freeze an area in the disinvestment phase by acting as a sort of ceiling on potential rents.

Finally, of course, zoning laws can act as an accelerant on the reinvestment/gentrification phase by effectively capping population in neighborhoods where lots of people would like to live, forcing some of those people to move to adjacent communities, and raising actual and potential rents there.

There’s obviously quite a bit more to say about all this; hopefully I’ll find the time to do so soon, and hopefully I’ll also hear from other people who have thought of things I haven’t. But, as I’ve said before, neighborhood change is easy to experience – and is too often talked about – as a kind of capricious, unpredictable thing. In reality, it appears that it’s heavily influenced by certain patterns and rules. To the extent that we’re unhappy with what neighborhood change looks like, understanding those rules, so that we can change them, seems important.

Teardowns and the Valley of the Small Apartment Building

A new study on teardowns in the Chicago suburbs has been making the rounds on urbanist Twitter, and provides an excuse for looking at the phenomenon of zoning-constrained redevelopment outside the city. In Chicago proper, it’s a little hard to do this precisely, because a) common zoning limits vary from single-family homes to two-, three-, and four-flat apartment buildings, and so a given permit for a three-unit building might represent densifying a lot that used to have a single-family home, or it might represent a “teardown” replacement of an older three-unit building; and b) the huge amounts of development downtown mask the very spare development of large multi-unit buildings in the neighborhoods.

But the suburbs, by having much more restrictive zoning, make this easier. First off, unlike Chicago, the overwhelming majority of existing lots are single-family homes, so a three-unit permit is much, much more likely to represent densification; and second, they’re mostly small enough that the downtown-neighborhoods dichotomy doesn’t matter nearly as much. (Which is not to say it doesn’t exist, as we’ll see with Evanston; just that when the city’s total area is only a few square miles, concentrating development in one area is much less consequential.)

Anyway, just as the city of Chicago’s zoning encourages developers to tear down older single-family homes, two-flats, and three-flats, and replace them with buildings of equal or lesser density built for wealthier customers – because they’re not legally allowed to build a larger number of potentially cheaper units – I strongly suspect that suburban teardowns are encouraged by zoning regimes that don’t allow for densification of single family home areas. In the absence of the option of building more units, it makes economic sense to just build bigger single family homes.

permits
Source: socds.huduser.org/permits

The chart above shows what it says – residential building permits in five suburbs from 2000 to 2013. The bottom four are all identified by the teardown study as being particular hotbeds of teardown activity. Evanston is not, but we’ll come back to what makes it interesting in a moment.

One thing that stands out is that Wilmette and Winnetka have literally not allowed a single new apartment building since the turn of the century.

But what I think is most relevant here about all five suburbs is that there is virtually no construction whatsoever of small apartment buildings of two to four units. In fact, Glenview is the only town that issued enough permits for those kinds of buildings for them to even be visible in the chart.

Fascinatingly, when these suburbs do allow new multi-unit apartment buildings, they are virtually all of the large, five-or-more unit variety – and I strongly suspect, having been to these places, that if we could set the threshold higher – say, ten or twenty or forty units – that we would see that virtually all new multi-unit projects are very, very large indeed. This reflects a peculiar dichotomy in zoning in places like Evanston and Park Ridge: neighborhoods are either zoned for single-family homes, or very large residential buildings. The large building areas in these suburbs tend to be in very high-demand areas that have historically been denser than the rest of the town – downtowns centered on an old commuter train station, say – or some out-of-the-way parcels, often separated from the rest of town by a large road or train tracks, where the town decided they could brook lower-income apartment development.

Evanston's zoning map illustrates the issue: everywhere except for the blue Downtown zones in the center - and the darkest R5 and R6 zones around it - multi-family development is either illegal or requires extremely impractical minimum lot sizes.
Evanston’s zoning map illustrates the issue: everywhere except for the blue Downtown zones in the center – and the darkest R5 and R6 zones around it – multi-family development is either illegal or requires extremely impractical minimum lot sizes.

What that means is that the sort of gradual, small-scale densification that might make sense in a residential neighborhood where rising prices are creating pressure for redevelopment – replacing a single family home with two to four units on the same lot – is ruled out. Instead, developers either have to build big within a very small geographic area, where those areas exist at all, or they have to do a single-family teardown.

Interestingly, Evanston – which, relatively speaking, has taken the build-it-big philosophy to heart, allowing more large residential construction, and thus more added density, than any other mature Chicago suburb – is also not identified as a place with a teardown epidemic, despite having real estate prices that are definitely comparable to places that are. Whether that’s because of regulations that prevent teardowns, or a release of development pressure via huge condo and apartment projects, I have no idea. But it is notable.

I should also note that this dichotomy isn’t necessarily terrible: especially if dense development is focused around transit stations, it’s a perfectly reasonable way to allow housing supply to grow, and thus help keep prices from skyrocketing, while protecting large single-family-home neighborhoods, if that’s a local priority. That, for example, is something like the Toronto model, where skyscrapers are allowed within a quarter mile or so of outlying subway stations, surrounded by a sea of relatively low-density housing. That said, of course, the scale of density that’s required in those islands for it to balance restrictions elsewhere is pretty massive, and it seems clear that even Evanston isn’t close to reaching those levels.

Which means that it’s a shame that smaller-scale densification that might be more palatable to single-family neighborhoods is off the table. There are many examples of neighborhoods throughout the metro area where single-family homes and two- to four-unit apartment buildings coexist quite peacefully; we ought to be creating more of them.

NB: I should note that the city of Chicago also has a “valley” of medium-sized development, but it’s in the sort of four- to ten-story midrise building, rather than three-flats. The basic dynamic is the same, though: zoning allows for either very little, or no, increase in density, or a massive increase in density in a very small geographic area. Gradual densification of the sort that has typified urban development for most of our history is off the table.

Eighty years of Chicago’s population, annotated

With one caveat: this is not meant to be remotely comprehensive, because I don’t know enough to give a comprehensive overview of Chicago’s population trends since 1930.
401930s. Population at the end of the decade: 3,397,000. Up 20,000.

By the 1930s, the trends that we think of as beginning in the post-WWII era are actually already quite visible: depopulation of the older neighborhoods, and relatively rapid growth in outlying neighborhoods that resemble car-oriented suburbs. The trends are muted, though, because the economic situation means there isn’t much construction. To be honest, I’m not quite sure what’s going on in the Loop and South Loop, which both lost well over 30% of their populations. Comments would be appreciated.

50

1940s. Population at the end of the decade: 3,621,000. Up 224,000.

As the economy comes back, those greenfield suburban-type neighborhoods explode, largely with single-family owner-occupied homes subsidized by the newly created federal mortgage system. Many inner neighborhoods continue to lose population, although interestingly the older lakefront neighborhoods appear to be generally stable. By far the most interesting, and ominous, part of this picture is the Black Belt, or what’s now called greater Bronzeville: the stretch of lakefront neighborhoods just south of downtown, whose populations boomed between 40 and 75% during this decade. That’s because in the 1940s, the Second Great Migration began, and hundreds of thousands of black people arrived in Chicago from the South, only to find that racial segregation – which only a generation or two before had existed in a much milder form – had calcified to the point that their only option was to live in the ghetto. Since the white people around the ghetto weren’t letting it expand at this point – people who tested the boundaries were liable to have their homes bombed – the Black Belt simply became horrifically overcrowded.

Another way of putting that, of course, was that there was an extreme housing shortage for black people, since there wasn’t much new building within the ghetto, either. Those of you who read this blog may guess what comes next: unlike the current dynamic, in which housing in black communities is usually very under-priced thanks to a lack of demand, because non-black people refuse to live there, black housing in the 1940s was radically over-priced. Black families would routinely pay significantly more than white families for smaller, older, less sanitary, and more dangerous apartments.

60

1950s. Population at the end of the decade: 3,550,000. Down 171,000.

The ghetto breaks. In part, this is by design: the late 1940s and 1950s begin the era of large-scale urban renewal, which is largely focused on the areas near the Loop occupied by people that City Hall and downtown business leaders consider undesirable. Mostly, this is black people. Massive displacement on the northern end of the Black Belt is actually opposed by whites on the far South Side, who anticipate – correctly – that there’s simply nowhere for those black people to go within the existing ghetto.

The Lake Meadows project began what would eventually be the total destruction of a contiguous mile-long section of tens of thousands of black homes and businesses. This was completed by the early 1950s.

The spread of black families, a pent-up demand for housing because of low rates of construction from 1929 through the end of the war, and the creation highways to the suburbs produced an exodus from nearly every built-up neighborhood in the city. Areas with available sites for new construction along the edges of the city still saw huge population gains.

70

1960s. Population at the end of the decade: 3,367,000. Down 183,000.

Basically the same as the 1950s, except black people had by now been forced into a second large ghetto on the West Side, and white people began fleeing in massive numbers there as well. The two community areas that saw modest growth in the heart of the Black Belt, surrounded by expanding waves of severe depopulation, are where the five-mile-long string of segregated, high-density public housing towers were built.

Also in the 1960s, Mayor Daley bulldozed much of the old Near West Side, including Little Italy, to build the campus for the University of Illinois at Chicago. Residents further west, in Garfield Park, had requested that the university be placed in that large park, which would have a) spared tens of thousands of people having their homes bulldozed, and b) potentially created a social and economic anchor in a neighborhood that was clearly in the path of ghettoization. But Daley declined.

80

1970s. Population at the end of the decade: 3,005,000. Down 362,000.

The wave of extreme depopulation following ghettoization spreads outward to places like Englewood in the middle of the South Side and West Garfield Park on the far West Side. Also notable, though, that Latino immigration is by now leading to population gains along a sliver of the Southwest Side, through Pilsen and Little Village.

90

1980s. Population at the end of the decade: 2,784,000. Down 221,000.

Depopulation continues on the South and West Sides, especially in and around areas where black people have moved. Latino immigration expands the area of growth on the Southwest Side. Large parts of the North Side are also stabilizing after several decades of decline, especially where there are immigrants.

00

1990s. Population at the end of the decade: 2,896,000. Up 112,000.

The first increase in population since WWII. There’s a huge increase in the number of Latinos, and they move into neighborhoods throughout the Southwest and Northwest Sides. Downtown and the north lakefront neighborhoods see rapid gentrification, although outside of downtown, restrictive zoning prevents that gentrification from turning into significant population gains. Hyde Park and South Kenwood – the light-blue areas along the south lakefront – have also stabilized. Meanwhile, the public housing projects built in the 50s and 60s have officially been declared failures, and the Hope VI federal initiative gives cities an incentive to redevelop those projects as mixed-income housing. The Chicago Housing Authority begins letting the projects empty out before demolishing virtually all of them in the next decade; I suspect that goes a long way to explaining the continuing rapid decline in population in greater Bronzeville. Early this decade is also the peak of the crack-era crime wave, and Bronzeville, not coincidentally, is perhaps the single most dangerous place in the city.

10

2000s. Population at the end of the decade: 2,696,000. Down 200,000.

Massive construction and population growth downtown is more than offset by declines virtually everywhere else in the city. The wave of Latino population growth has crested and begun to move out into the very outer neighborhoods and suburbs. Blacks leave the South and West Sides, including many who are displaced when the last of the public housing towers are torn down, and no one comes to replace them. Meanwhile, restrictive zoning on the North Side means that even as places like Lincoln Park and Lakeview reach all-time highs in prestige and median income, new construction mostly takes the form of luxury buildings replacing older buildings with roughly the same number of units. These neighborhoods remain 20% to 60% below their peak populations.

PopGIF


Where did Chicago’s population decline?

Recently I’ve been doing a bit of digging into Chicago’s population figures, with the general research question being: what parts of the city have seen their population fall the most? There are a number of reasons that population matters, beyond civic pride: tax receipts, for example, as well as a consumer base for local businesses. Because jobs generally follow people, a shrinking center city also means that a larger percentage of jobs will be out in the suburbs, far from public transit, making that transit worth less and less to people who would like to use it to commute. As a result, people either a) just don’t have access to lots of jobs, b) spend a huge amount of time commuting, which they can’t spend, say, taking night classes or caring for their kids, or c) spend a bunch of money on a car, which is money they’re not spending on, say, night classes or caring for their kids.

Anyway, here’s a quick overview map:

Decline5010

A few notes:

1. The historic “black belt” – the area from roughly 26th down to Woodlawn (the neighborhood), from the Dan Ryan to the lake – got hammered. This isn’t surprising for a number of reasons. The first is that the black belt – especially the older parts in central Bronzeville – was horrifically overcrowded in the 1940s. In Making the Second Ghetto, Arnold Hirsch estimates that there were three times more people than were meant to live in the housing that existed. (Why were they so overcrowded? Because black people weren’t allowed to live anywhere else, and a huge wave of migration from the South had dramatically increased the city’s black population. Shortly thereafter, South Side whites began to flee for the suburbs, and Bronzeville began to empty of the relatively better-off black households who could afford to move further south.) Most of the others have to do with urban renewal, and the purposeful removal of people from potentially high-value land near the city center.

2. The difference between North and South Lawndale – the dark red area just above the dark blue area on the western edge of the city – is here, as in so many other ways, illustrative of the effects of public and private disinvestment and shunning on black communities, as opposed to working-class white and immigrant ones.

3. The wealthy north lakefront neighborhoods have lost significant population, contrary to popular belief. Lakeview is down over 20%; Lincoln Park, over 30; and West Town (not lakefront, but home to Wicker Park, Bucktown, and Ukrainian Village) is down over 40%. Why? A combination of a) a dramatic decline in the number of people living in any given housing unit, as large families were replaced by smaller families, childless couples, and people living alone; and b) a decline, or at best stagnation, in the number of housing units thanks to zoning restrictions.

More on all this later.

Excerpts from “The Formation of American Local Governments,” by Nancy Burns

Scholars have argued that part of the reason for the Salem witch trials was that Salem Town refused to let Salem Village secede to form an independent town. The residents of Salem Village faced land constraints and consequent decreasing income; the residents of Salem Town had access to other forms of income because the male residents there were largely merchants. Salem Village repeatedly petitioned for its own government; just as repeatedly, Salem Town refused. The Salem witch trial accusers were from Salem Village; the accused were from Salem Town. (p. 34)


Exclusionary zeal in various forms has been a part of American local institutions from their beginning…. The earliest tradition is the establishment of towns that create economic homogeneity…. In the seventeenth century this process was led by English merchants who planned the colonization of New England. The resulting communities are exemplified by the founding of Watertown, Massachusetts, in the late 1630s: “Everyone hoped that there would be no poor, and Watertown had made special provisions to exclude them.” To that end, they established that “anyone who ‘may prove chargeable to the town’ could be ordered to leave.” (p. 35)


Church groups in St. Louis decided to purchase twelve acres of land in Black Jack, Missouri, an unincorporated section of St. Louis County, in 1969. The land was zoned for multiple-family dwellings. The groups planned to build racially integrated, moderate-income housing on the site. Almost immediately, the white residents of the area…petitioned the St. Louis County Council to incorporate the area. They succeeded. Immediately upon forming the municipality, they zoned apartments – including publicly funded ones – out of the city. (p. 36)


“The real issue is not taxes, nor water, nor street cars – it is a much greater question than either. It is the moral control of our village. Under local government we can absolutely control every objectionable thing that may try to enter our limits.” – suburban Chicago newspaper editorial in favor of incorporating as a separate municipality, 1907  (p. 37)


“Planners and zoning experts often appeal to their clients, that zoning for height and lot area, and sometimes other items, will protect them from ‘undesirable neighbors.’ In fact, all the arguments adduced to show that zoning protects property values are meaningless unless they imply this important element in the determination of values. No height restriction, street width or unbuilt lot area will prevent prices from tottering in a good residential neighborhood unless it helps at the same time to keep out Negroes, Japanese, Armenians, or whatever race most jars the natives.” – Bruno Lasker, academic, 1920  (p. 57)

Americans have discovered in local institutions effective barriers to racial and economic segregation. Living within particular city boundaries means that schools will not be integrated, that neighborhoods will not be integrated, that offensive industry will not be apparent, and that taxes will not be higher. It also means that the problems of people in other – even, and especially, neighboring – cities will be considered irrelevant to local politics….

Because municipal boundaries can be boundaries between races and classes, boundaries that reinforce homogeneity, the possibilities for transformative public discussion in local politics are severely limited.

Moreover, the space we have created for local political autonomy means that we allow local boundaries to define citizenship, and we allow that definition of citizenship to carry weight in American politics. Boundaries, and the import we give to them, can thus legally impede desegregation efforts, halt efforts at redistribution, and restrict access to services. (p. 117)

On the subject of Metra

Got a couple other things in the works, but for the moment, a developer read my post at Streetsblog last week about how Metra needs to get some people near its damn stations and proposed a 20-story rental tower across the street from a station in suburban Park Ridge. Park Ridge is not amused:

“Something like this is not going to be well-taken. And it’s not well-taken by me,” said commissioner Jim Argionis.

“We can’t make this work. This can’t be done,” Kocisko said. He added that though the city may generate added property tax from the development, there would also be an increase in city services required for so many new residents.

Kirkby called the plan “preposterous” and compared the design to something that might be found in Chicago’s Gold Coast neighborhood or in Dubai.

A couple thoughts.

1. That is one ugly building. (There’s a rendering in the article I linked to.)

2. Park Ridge is exactly the kind of suburb/neighborhood that is hugely desirable and yet has used its zoning laws to keep out the kind of people for whom moving to Park Ridge would be a major advancement in terms of neighborhood safety, access to jobs, and high-quality public education. As of 2010, Park Ridge was 93% white, the median family income was $110,000, and the median house sold for $420,000. It’s got to be less than half an hour on Metra to downtown Chicago. And yet Park Ridge – like, say, Lincoln Park – actually lost population between 2000 and 2010.

3. In the real world, Park Ridge is never going to approve a 20-story glass box in the middle of a small, low-rise downtown surrounded by single family homes. But there is, in fact, a middle ground. Instead of saying “We can’t make this work,” a commissioner might say something like: “This plan as submitted doesn’t make sense for Park Ridge. But we know that we have to let our town grow. Come back to us with something that won’t look like it was airdropped in by mistake. Come back with a midrise, in other words, whose aesthetics match the expectations of the community.” There are ways to add density without sticking your finger quite as deeply into the eyes of your new neighbors.

Just for fun, here’s Park Ridge’s zoning map. See if you can find the places where apartments aren’t illegal! (Hint: It’s almost nowhere.)

parkridgezoning

Watch New York City’s middle class (and poor) get pushed around; or: the incredible invisibility of disadvantage in the proximity of privilege

EDIT: Actually, there is something in particular I’d like to get out of this. It’s similar to the point I made with the Brooklyn map: namely, that the invisibility of the poor and nonwhite when they aren’t interacting with more privileged people is just astounding. Look at Manhattan; look at the Bronx. Look, for that matter, at Brooklyn again. Whose stories do we hear?

That would be a stupid rhetorical question – duh, Daniel, we hear rich people’s stories – if it weren’t for the fact that even I, a person who has made this exact point multiple times before, was shocked at the extent to which very low-income neighborhoods persist in New York. Why was I so surprised? Because all people talk about is how New York has become a gated city of the ultra-rich. Because of the social bias that I just suggested was blindingly obvious. And which nevertheless, in this case, I fell for.

And if I fell for it in this case, then surely I’m still falling for it in dozens of others. Andrew Sullivan’s blog, for as long as I’ve read it, has carried on its masthead an Orwell quote: “To see what is in front of one’s nose needs a constant struggle.” That’s true in a very general way, of course, but it’s also worth remembering that it’s true in some pretty specific ways: for whatever reason, the struggle is particularly difficult when it’s poor or nonwhite people in front of your nose. That’s a lesson for anyone who cares about cities – or, you know, humans, since an interest in cities is at bottom an interest in humans and their habitats – whether you’re part of the media, or an urban planner, or a neighborhood activist, or just one of those humans in their habitat.


I’ve been holding onto this for a while, not quite sure what to do with it, but now I’m releasing it into the wild. It comes from the same data set and researchers (Sean Reardon and Kendra Bischoff) as the Chicago map, with the same disclaimer that any mistakes in the translation of spreadsheet to map are entirely of my own doing.

Anyway, I know much less about New York’s social geography than I do Chicago’s, so I won’t say too much, but several things obviously stick out here. One is that though Manhattan has almost entirely eliminated middle-class or economically balanced neighborhoods, the rest of the city has a good deal more of them than Chicago. To some extent, I suspect this has something to do with New York’s much more ambitious (and, sometimes, progressive) housing policy: fewer than half of tenants there live in pure market-rate housing. Although New York, like most of the rest of the country, would do well to allow more housing where there’s capacity, demand is high enough that lots of subsidies are likely called for.

The other thing is just how much of New York, currently a global symbol of gated-city affluence, is actually poor. Look, for example, at the Bronx: it’s a sea of red. A decent amount of Brooklyn, too. Another reminder of how the obsession with gentrification obscures the larger issue of income segregation.

Also: man, Harlem is gentrifying. That sort of dark-red-to-green is something you didn’t see too much in the Chicago map.

Finally, this map really ought to have a scale capable of showing the extremes of wealth in parts of Manhattan that just don’t exist in Chicago. Twice the metro median family income really doesn’t cut it.

* These are not polished maps: I just don’t have time to polish them, but I wanted to get them out, and the broad trends are pretty apparent. You’ll see that some tracts in Staten Island are missing until 1990-2000; I figure people don’t care that much about Staten Island. (Sorry, Staten Island.) Also there are some weird things that happen with tracts that include parks, where small populations are included where they weren’t before. Apologies.

NYGIF


frame_000 frame_001 frame_002 frame_003 frame_004

Where does Chicago’s black middle class live?

(As a foreword: I’m very conscious, as I write this, that I’m explaining something a large number of readers already know; I want to acknowledge that what I’m doing is not unearthing some previously-undiscovered secret, but trying to demonstrate a few of the basic facts of the city’s social geography that really, truly are mysteries to a huge number of people, both in Chicago and in the rest of the country. It would be nice if we lived in a world in which the black middle class were not an exotic demographic to most non-black Chicagoans, let alone the dominant view from outside the city: but we don’t, so here we are.)

There are at least three ways one might go about answering that question.

1. If you picked a random middle-class black person, where are they most likely to live?

To answer this question, you probably just want to count up all the middle class black households and tally them by neighborhood. So that’s what I did. The tricky part, obviously, is defining “middle class.” In the end, I went with something like what I did with my Chicago income segregation maps: households making at least 75% of the metropolitan average income, which works out to about $45,000 a year. There are a million problems with this: it doesn’t account for household size, or life station (a 26-year-old with a bachelor’s making $40,000 doesn’t count, even though nearly anyone who met them would consider them middle class, while a single parent with four children making $45,000, whose economic and social position is likely much, much more precarious, does), or any number of other things. I considered using education, but in a city like Chicago – and this is especially true among African Americans, I think – a huge number of people with middle-class lives have union jobs that don’t require a college education.

Anyway, with all those caveats, here’s the map:

B45totSo the answer is mostly on the South and West Sides: that’s Austin there on the far West Side, with the largest number; Roseland, Auburn Gresham, and South Shore are the leaders on the South Side.

There are things to say about this, but I’m going to go through the next two maps before I say them.

2. If you picked a random person in a given neighborhood, what’s the likelihood that person would be black and middle-class?

B45per

In effect, what this does is control for the number of people in each community area. Austin, for example, which looked super impressive in the first map, now looks less impressive; it turns out that it has a lot of middle-class black people mostly because it has a lot of people, period.

Anyway, the standouts now are Calumet Heights, the darkest-blue trapezoidal shape on the far Southeast Side; Avalon Park just to the north; and Roseland, Washington Heights, and West Pullman on the far, far South Side.

3. Finally, if you picked a random black householder in a given neighborhood, what is the likelihood that person would be middle-class?

B45perofB

This is a considerably weirder, and in some ways more misleading, map. There are now standouts on the Northwest and Southwest sides, in addition to the far South Side; but, if we refer back to the first map, we see that most of those places have vanishingly few black households to begin with. In fact, it’s much worse (in the sense of the numbers are much smaller) than that map even suggests: in many of the darkest-blue areas, we’re talking about dozens of households. Many of these are areas that, up until twenty years ago or so, had literally – or almost literally – zero black residents. To the small extent that they’ve been integrated since then, they’ve been integrated with solidly middle-class people.

Anyway, a few notes on the whole thing:

1. The black middle class exists in Chicago. In large numbers. This shouldn’t really be news, but speaking in my capacity as a white person who knows a lot of white people, and other people of various ethnic backgrounds from the North Side and suburbs and other parts of the country/world, it really is.

2. Perhaps even more importantly, the vast majority of Chicagoans who are both black and middle-class live on the South Side, and to a lesser extent, the West Side.

3. The concentration of middle-class households varies dramatically from one black neighborhood to another.

4. Still, the majority of Chicagoans who are middle-class and black live in neighborhoods that are mostly not middle-class – as opposed to Chicagoans who are middle-class and white, for whom the opposite is true. In this way, Chicago is pretty similar to the rest of the country.

The takeaway, for me, is that these maps contradict two of the biggest lies – or, if we’re being kind, misconceptions – about the social geography of Chicago. The first is that the black neighborhoods of the South and West Sides are an undifferentiated landscape of economic hardship. This is false in a couple of ways. For one, though there are, in fact, many people who are suffering for want of a decent wage in these areas, there are also many thousands of households that are not. (Though they are likely still disadvantaged by other consequences of segregation, including worse access to jobs and basic amenities, higher crime, lower-performing schools, etc.)

For two, just like white, Hispanic, and Asian people, black people are segregated by income. That is to say: some black neighborhoods are much wealthier than others. Of course, this kind of stratification is complicated, since it’s layered on top of – and interacts with – racial segregation. But the view of Chicago as bifurcated between the privileged North Side and deprived South Side needs to get sophisticated enough to recognize the major differences in privilege/deprivation between, say, Englewood and Calumet Heights. It also needs to recognize that even in neighborhoods that are majority low-income, there are generally a significant number of middle-class residents.

The second big lie, related to the first, is that basically everyone on the South and West Sides would get out if they could. This is sometimes stated explicitly; more often, I think, it’s the unspoken assumption that frames most outsiders’ conversations about those parts of the city. It assumes that everyone in Chicago follows roughly the same ladder of neighborhood prestige: one that tops out in Wicker Park, or Lincoln Park, or North Center, or Norwood Park, depending on your family status and subcultural preferences.

But this isn’t remotely the case. Someone who had only lived on the North Side – or outside the city – might figure that the reason there are so few black people (or Latinos! more on that in a sec) in, say, Lakeview, is that Lakeview is so expensive, black and Latino people have lower average incomes, etc., etc. And surely that is, in fact, a large part of the answer. But it’s not the entire answer, and one way to prove it is to show that, actually, the median black householder in Lakeview actually makes less money than the median black householder in Roseland, a neighborhood whose name is usually accompanied in media reports with adjectives like “struggling,” or “blighted,” and so on. It’s actually not even close: over $40,000 in Roseland, versus $33,000 in Lakeview. Those sorts of inversions of North Side/non-Chicagoan perceptions about neighborhood prestige are actually pretty common: black median household income is $24,000 in West Town, $31,000 in Lincoln Park, and $35,000 in North Center, but $39,000 in West Pullman,  $42,000 in Washington Heights, and $56,000 in Calumet Heights. And in Ashburn – a neighborhood on the very southwestern edge of the city that’s about 50% black, and which most North Siders (including me, until friends moved there a few years ago) have never even heard of – it’s over $70,000.

Why does all of this matter? Number one, it’s something that lots of people are wrong about, and I don’t like it when people are wrong about things. More generally, though, widely-held perceptions of neighborhood quality and prestige – especially when those perceptions are held by people with lots of economic and political power – play a huge role in shaping the future of any given neighborhood. From a governance perspective, there are lots of reasons you’d want the people in charge of a city to have an accurate impression of the communities they’re governing before they start making up policies for them; but also from a purely social point of view, the fact that most non-black Chicagoans – and the vast majority of non-Chicagoans – can’t distinguish between Englewood and Calumet Heights means that they won’t ever visit, spend money, and certainly won’t consider living, in neighborhoods that they would likely find generally pleasant. (I apologize for picking on Englewood: I definitely don’t mean to suggest that it doesn’t also have positive qualities, or that no one should go there. I’m making some big-picture observations about the size of its challenges relative to other neighborhoods, and common ways that people react to places with those kinds of challenges.) In short, it’s hard to build much of a local economy in a place that 75% of the population shuns without even thinking about it. (Read Robert Sampson’s Great American City for more on that.)

Anyway, this post is now long enough: I have more to say, but I will put it off to another time. I’ll leave you with two final maps: versions of map #1 above for Latinos, whites, and Asians. They’re fairly self-explanatory, but suffice it to say that most of this post could be rewritten, with only minor edits, to apply to Chicago’s Latino middle class as well.

L45tot

W45tot

A45tot

Redlining: A Clarification

Friend of the blog Ted Whalen asked me this on Twitter after my last post:

Good point. If you look at the redlining map I posted, you’ll see that virtually all of the city (at least, what I clipped – you can see the full map here) is under some kind of mortgage insurance restriction, and a good deal of it is “redlined” – meaning the federal government refused to insure any mortgages of any kind. Even neighborhoods that today are quite well-off, including large parts of Old Town, Lincoln Park, and Wicker Park, were totally shunned.

A 1938 FHA map of Chicago. Note the loan guidelines for each color-coded zone on the bottom right.

For those of you who are unfamiliar with this history, you should go read Ta-Nehisi Coates’ essay. But the short version is that one of the most powerful and far-reaching New Deal-era policies, in terms of creating wealth among the working and middle classes, was reforming the way people bought houses. Prior to the New Deal, buying a house generally involved paying a huge lump sum up front, and/or taking on possibly multiple complicated, short-term, high-interest, generally unpleasant or financially dangerous loans. As a result, not very many people bought houses.

President Roosevelt changed that by creating federally-insured home mortgages that guaranteed certain buyer-friendly terms, including much smaller down payments and, crucially, 30-year payment periods. All of that dramatically lowered per-month payments, which were now affordable to the average member of the broad middle class. In essence, it was a massive subsidy program so that regular people could buy homes. Since homes, generally speaking, grow in value, and because they tend to be the single most valuable asset that most people have, it was also one of the single greatest generators of wealth in American history.

The problem for black people (and cities, and in a moral sense America itself) was that those subsidies were only available in certain areas. Basically, the federal government drew maps like the one above for the entire country, identifying neighborhoods that were too “risky” to insure loans in. One major indicator of “risk” was an aging building stock and “old-fashioned” urban design, which basically meant everything that today’s urbanists hold dear: mixed-use buildings, apartments instead of single family homes, etc.

But another major indicator was black people. Not some proxy for black people, or a sneaky back-door measure designed to exclude them: the federal government explicitly refused to insure any neighborhood that contained black people, or even neighborhoods adjacent to other neighborhoods that contained black people, for fear that soon some of the nearby black people might contaminate it. This was not a joke: in Origins of the Urban Crisis, Thomas Sugrue tells the story of a developer who wanted to build a white subdivision on the edge of Detroit in the 1940s. The problem was that the land he owned abutted a pre-existing black enclave, and the Federal Housing Administration was nervous about insuring loans in the area. To allay those fears, the FHA – the federal government – insisted that the new white development be separated from the black enclave by a six-foot-high concrete wall.

The wall, soon after it was built.
Amazingly enough, it still exists.

These policies didn’t begin to change until 1968, and private use of redlining wasn’t aggressively battled by federal law until the 1977 Community Reinvestment Act.

Anyway, the result of all this was that a) black people were excluded from the single largest wealth accumulation program in the history of the world to that point, and b) black neighborhoods – as well as many other inner-city areas – were systematically starved of capital that might otherwise have been used to keep buildings in a state of good repair. This was a major cause of their decline.

It’s notable, though, that lots of non-black neighborhoods were also redlined, as you can see in the map above. So if redlining was so important, why aren’t western Lincoln Park and Wicker Park facing the same kinds of problems as black neighborhoods?

I think there are a few answers to this question. The first is simply that up until relatively recently, they were.  Wicker Park, before it was the commercial heart of the Northwest Side, was a downtrodden and largely Latino neighborhood with a crime problem. Before that, wealthy Lincoln Parkers near the lake were sure that redevelopment and gentrification would never make it west of Halsted – to the areas that had been redlined.

The second is that those areas became revitalized as a result of an influx of mostly white people whose families had mostly chosen to bring them up elsewhere, largely in outlying urban or suburban neighborhoods where they had been eligible to buy federally insured homes and become solidly middle class or upper middle class, with home-based wealth as an anchor for that economic status.

The third is that while some white people were subject to redlining, the majority weren’t, which created the huge supply of relatively well-off white people who could bring resources back to places like Wicker Park. On the other hand, anywhere a black person successfully bought a home was, by definition, redlined, so a much, much tinier group of them made it to the comfortable middle class. (Even where black income matches white income, black wealth – which plays a huge role in absorbing shocks that might otherwise send a middle-class person back into economic instability, or financing investments in future earnings like college tuition – is usually tiny compared to their white income peers.)

The fourth and final reason is that because of a variety of economic and social factors, white people have been extremely hesitant to move to black neighborhoods. (Read: Federal policy made black neighborhoods, on average, more run-down and unattractive to the average home buyer, and white people also are racist about living around black people.) Combined with Reason Number Three – the tiny supply of wealthy black households – that means that even after redlining was abolished, there was no large middle-class cohort ready to swoop in and bring money back into black neighborhoods. Rather, the legacy of disinvestment was left to fester, and the opening of the broader housing market meant that middle-class blacks could leave for greener pastures. Which was, of course, great for them, but it also meant that even more capital was leaving those already capital-starved neighborhoods.

This may or may not be exactly what Ted was getting at – maybe I just should have tweeted a link to the full map – but it’s important stuff anyway. Read on.

Reparations

A 1938 FHA map of Chicago. Note the loan guidelines for each color-coded zone on the bottom right.

By now, certainly, you’ve heard of Ta-Nehisi Coates’ landmark piece on reparations in The Atlantic. If you haven’t read it, the essay is less about reparations per se – writing checks and so on – and more about grappling with and acknowledging the basic sources of American racial inequality.

I won’t quote any of it here; you really just have to read it. Certainly you should read the middle sections, in which Coates lays out, better than anyone I’ve seen, the established facts: how federal housing insurance policies, contract buying, and good old-fashioned violence, both mob and state-sponsored, led to the segregated, deeply unequal world we currently inhabit. If you think you already know the story, and you are not a professor of 20th century American history, you are probably wrong. Go ahead and read it.

Pete Saunders and others have already said it better than me, but this is all central to the American urban story: not just if you care about housing disparities and the racial wealth gap, but if you’re interested in urban design choices that were made in and around inner city neighborhoods; or if you’re interested in why so many urban neighborhoods were locked out of loans to fund rehabilitation and reconstruction of aging buildings, condemning them to decline and setting the stage for gentrification once the artificial barriers to development were removed.

The bottom line is that, to a great extent, we don’t have to wonder about why Chicago is so segregated, and whether it matters. The research has been done. The answers, as Ta-Nehisi Coates likes to say, are knowable. And we all owe it to ourselves to know them.