Over at City Observatory, I’ve published a new piece about the ways that urban geometry—which is really just a fancy way of saying “the fact that single family homes take up more space than apartments”—affects the way that neighborhood identity is formed. And, in turn, how that visual bias in the way neighborhood identity is formed reinforces some of the most basic inequalities in American life: economic, racial, and so on.
I minimized this a bit because I was writing for a national audience, but the impetus for the post really came out of an interest I had in a very Chicago-specific question: How bungalow-y is the Bungalow Belt? Or, more concretely, when people in the Bungalow Belt make claims about their neighborhoods’ “suburban character,” and then demand that public policy reinforce that perceived character, how firm are those grounds?
The answer is: well, it depends, but much less firm than they, or you, might think.
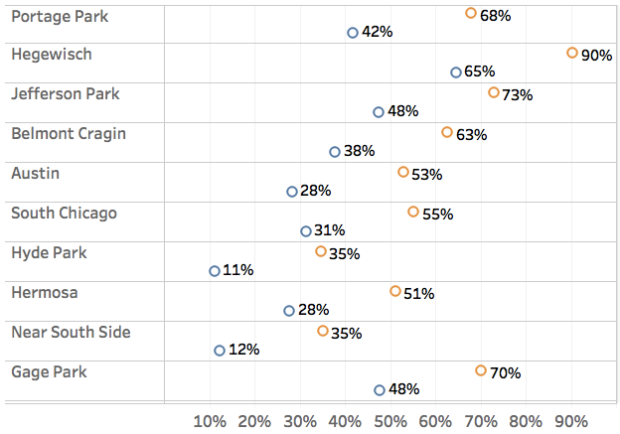
The City Observatory piece cites Jefferson Park in particular, in which the vast majority of residential land—72 percent—is covered by single family homes (thus “suburban character”), but in fact the majority of actual residents—52 percent—live in multifamily buildings.
That happens to be a particularly tidy outcome for me, especially because the article I linked to above is also centered on Jefferson Park, but it’s not at all exceptional. In fact, Jefferson Park isn’t even in the top ten Chicago community areas in terms of the gap between single-family homes as a percentage of residential land and as a percentage of residents:

Topping the list is Kenwood—where over half the land is taken up by single-family homes, but just 14 percent of actual humans there live in one. Kenwood’s gap is maybe unsurprising, since it combines one of the biggest mansion districts in the city with a large number of relatively high-density midrise (and a few highrise) buildings. South Shore, with the Wilmette-esque Jackson Park Highlands abutting very high-density multifamily buildings, is in a similar situation.

But even neighborhoods without that kind of notable density differential are on the list. Maybe most interesting to me is Chatham, one of the most iconic Bungalow Belt neighborhoods in the city, where two-thirds of all residential land is taken up by those bungalows—but, as it turns out, where just one out of three people actually lives in one.
If you map these disparities, you get this:

And that (incomplete) ring—belt, if you will—of very high differentials around the outer neighborhoods of the city happens to look a lot like another map:

…which happens to be a map of the Bungalow Belt as defined by the Historic Chicago Bungalow Association.
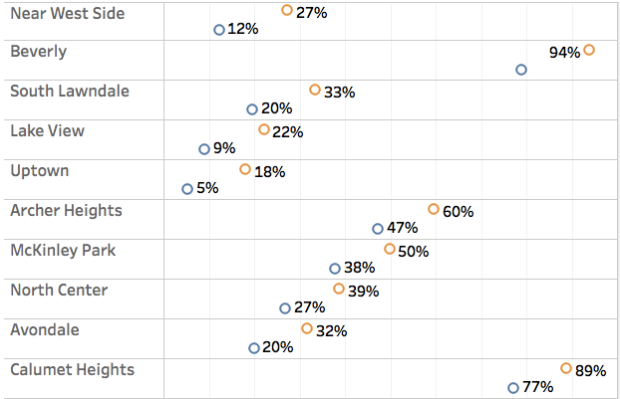
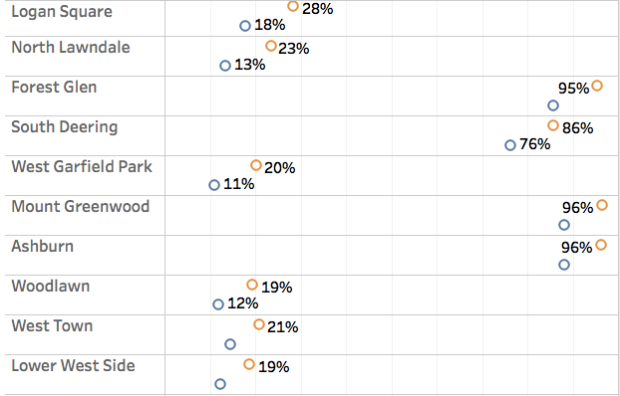
One other community area sticks out to me in that map: Lincoln Park, where fully 41 percent of all land is taken up with single-family homes, versus just 19 percent of people who live in them. Just to the north, in Lakeview, single-family homes take up just 22 percent of residential land; in West Town, adjacent to the west, which includes much lower-density areas far from the lakefront and the L, it’s just 21 percent. I don’t have the historic data for it, but I strongly suspect that Lincoln Park’s abundance of single-family home land is a relatively recent phenomenon, driven by the voracious pace of teardowns of single-lot apartment buildings, to be replaced by mansionesque townhomes, many of which take up two or more lots.
Which, in turn, is encouraged by awful low-density zoning that makes such activity the most profitable course for developers to take, as the city has neither allowed more lucrative higher-density development that would allow more people to live in the neighborhood, nor taken steps to preserve historic buildings and prevent the mansionization of an inner city district.
Anyway. The point of all this is not that I’m anti-bungalow. I like bungalows! Love, even! But, to repeat myself, neighborhoods (like this country!) are constantly in a state of competition for self-definition, because those self-definitions strongly imply a future course of action—whether the identity in question is Christian nation v. ecumenical nation, or suburban neighborhood v. urban neighborhood. In an American land use regime where “conforming with neighborhood character” is the north star*, determining what exactly a neighborhood’s character is can mean the difference between more housing and less—or more affordable housing and less, or more transit access and less, and so on.
What’s interesting here is a kind of self-perpetuating cycle: notwithstanding metropolitan area-wide trends, within any particular neighborhood, richer people almost always live in lower-density housing, because they can afford to buy the most space in whatever location they’ve chosen. But the very act of buying space means that they get to define more of the physical character of the neighborhood than other people—which reinforces their already-disproportionate power to influence both social-cultural expression and public policy. And then, in places from Lincoln Park to Edison Park (nearly 90 percent single-family home land, but nearly a third of whose population lives in multi-family buildings) to Jefferson Park, they use that ability to define neighborhood character by purchasing space to advance their preferred policy outcomes, which involves privileging more low-density development (and presumably the higher-income people who will live in it).
*The cynic in me will note that this ceases being the north star when the question is de-densification, ie, mansionization. In other words, when the “character” is “less rich than we wish it were.”